This forum is intended for questions about kinetics, Surface Plasmon Resonance and the instruments related to these techniques.
Negative binding to reference
- Technican
- Topic Author
- New Member
-

Less
More
- Thank you received: 0
2 years 11 months ago #1
by Technican
Negative binding to reference was created by Technican
Hello everyone, I have a question regarding negative signals in my binding to reference plot.
In our last screening assay, a very strong negative binding to reference occurred (sensorgram attached, colored by concentration), which we cannot explain or interpret. The samples (proteins ~ 18 - 20 kDa) were previously purified and should not contain any major impurities. We now wondered why we see negative signals in the binding to reference plot. Does the RU signal only depends on the refractive index of the sample?
Used setting:
Instrument: Biacore T200
Buffer: HBS-EP pH 7.4
Chip: CM5
Immobilization of anti-human-Fc antibody to all four channels
Capture of ligand (~ 80 kDa) via ahFc on FC2 (FC1 as reference)
Multi cycle kinetic containing 4 concentrations blank
Buffer mismatch can be excluded due to the fact that we use the same buffer for sample dilution and running buffer & we always prepare the buffer freshly.
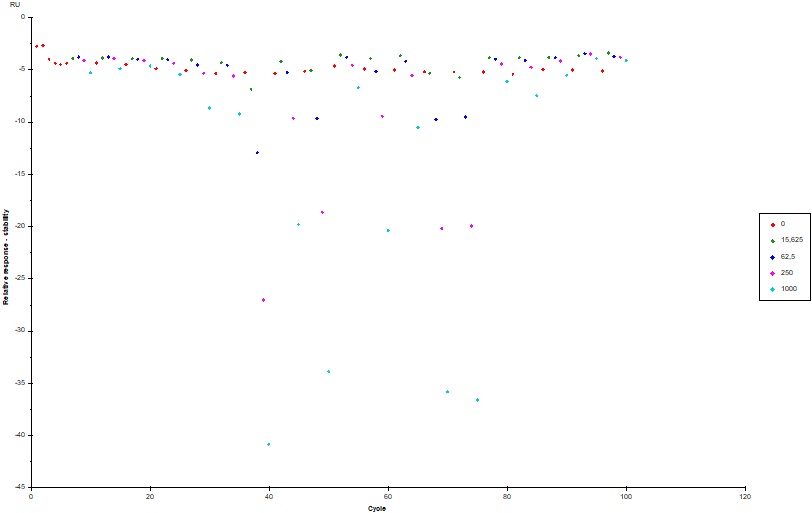
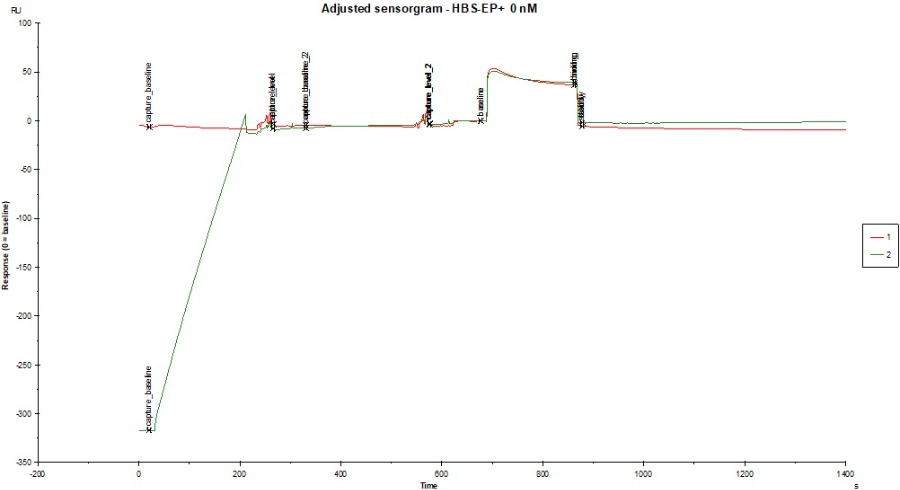
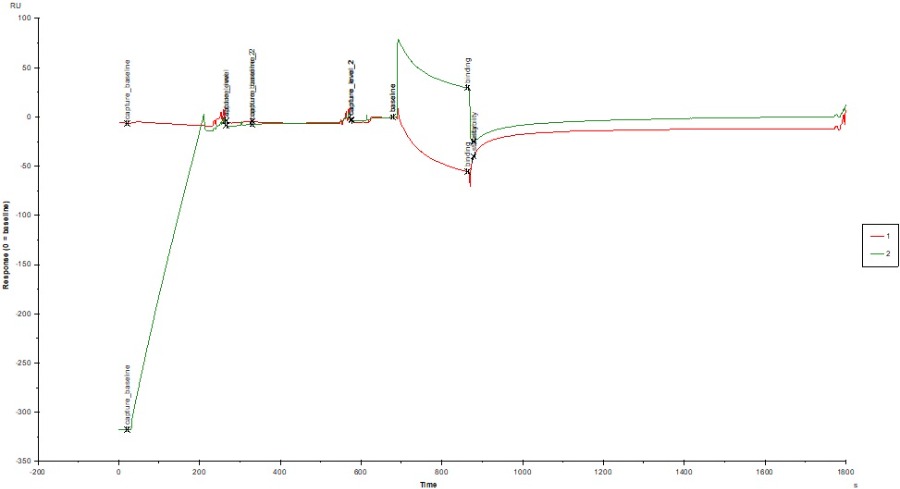
I attached a sensorgram of one sample (c = 1000 nM, colored by FC) where we observed the extreme negative binding to reference signal (~ -40 RU). You can see a curvature on Fc1 (negative) but i cant explain why the sample is doing that? Does the sample interfere with the dextrane matrix of the CM5 chip? Blank looks okay, not great, but also not horrible (also attached).
I would be very happy, if someone could help me out! Thanks in advance!!!
In our last screening assay, a very strong negative binding to reference occurred (sensorgram attached, colored by concentration), which we cannot explain or interpret. The samples (proteins ~ 18 - 20 kDa) were previously purified and should not contain any major impurities. We now wondered why we see negative signals in the binding to reference plot. Does the RU signal only depends on the refractive index of the sample?
Used setting:
Instrument: Biacore T200
Buffer: HBS-EP pH 7.4
Chip: CM5
Immobilization of anti-human-Fc antibody to all four channels
Capture of ligand (~ 80 kDa) via ahFc on FC2 (FC1 as reference)
Multi cycle kinetic containing 4 concentrations blank
Buffer mismatch can be excluded due to the fact that we use the same buffer for sample dilution and running buffer & we always prepare the buffer freshly.
I attached a sensorgram of one sample (c = 1000 nM, colored by FC) where we observed the extreme negative binding to reference signal (~ -40 RU). You can see a curvature on Fc1 (negative) but i cant explain why the sample is doing that? Does the sample interfere with the dextrane matrix of the CM5 chip? Blank looks okay, not great, but also not horrible (also attached).
I would be very happy, if someone could help me out! Thanks in advance!!!
Please Log in or Create an account to join the conversation.
- Arnoud
- Moderator
-

Less
More
- Thank you received: 0
2 years 11 months ago #2
by Arnoud
Replied by Arnoud on topic Negative binding to reference
Hi,
The blank (buffer only) injection has indeed a higher bulk effect than expected but it seems equal for both channels thus after subtracting the reference the curve should be fairly flat. I think no problem there. I assume you cap the vials?
Looking at the binding plot for the reference (it is reporting the stability reporting point) I see that the negative signal is proportional to the concentration of the samples (is this also the case with the active channel?). There are six samples with this behaviour. The around cycle 35-40 has the most negative signal.
The shape of the curve on the reference channel during analyte injection suggest some wash out or rearrangement of the surface (dextran and/or ligand). After injection the curve returns more or less to baseline therefore the is no mass loss from the surface.
Interestingly on the active channel the analyte injection starts with a big jump and a curve that is almost the same as on the reference. After the injection the active channel return immediately to baseline indicating that there is no binding (or very fast on/off). I have no explanation why there is a bulk jump on ch2 and not on ch1.
Regarding the samples. We observed that pure protein samples (SDS-Pages gel) can contain impurities that are not stained with Coomassie or other dyes. If you have the possibility, you can measure the absorption spectrum between 200 and 800 nm and look for abnormalities (peaks different from A280). We find sometimes co-purified DNA(A260).
Also remember that even diluting the sample in running buffer you add some of the sample’s buffer which can alter the bulk refractive index.
In most situations the procedure of double referencing will compensate for bulk differences.
I hope I have answered your question a little.
Kind regards
Arnoud
Please Log in or Create an account to join the conversation.
- Technican
- Topic Author
- New Member
-
Less
More
- Thank you received: 0
2 years 11 months ago #3
by Technican
Replied by Technican on topic Negative binding to reference
Hi Arnoud,
Thank you very much for your detailed answer. That really helped us out!
Yes, we do cap the vials. Regarding the reference binding plot: Yes, we also observe concentration dependent binding signals for the samples on the active flow cell.
So if there is no mass loss during the injection of buffer, we can assume that this does not affect the kinetic data?
Yes our proteins show very fast on & off-rates, so determination of kinetics is indeed difficult. But we also had 1 sample with rather fast on and slow off-rate, which also showed high negative signals in the binding-to-reference plot.
We are also performing a double referencing.
I do have another question: Why is the signal negative? If there is anything in the sample (impurities or maybe the sample itself) binding to the reference channel, why is the RU signal negative? Does it only depend on the refractive index?
Thanks for the hint with measuring the absorption spectrum between 200 and 800 nm. I will try this out.
Kind regards!
Please Log in or Create an account to join the conversation.
Moderators: Arnoud, Arnoud