Mass-transfer kinetics
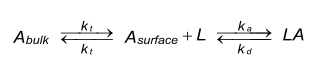
Binding of analyte to the ligand on the sensor chip is in principle a two step event. First, the analyte is transferred out of the bulk solution towards the sensor chip surface. Second, the binding of the analyte to the ligand takes place. The first step is also known as mass transfer and is carried out by convection and diffusion (1). Both events have their own rate constants. The coefficient for mass transfer kt is the same in both directions (2).
The mass transfer depends on the flow cell dimensions, the diffusion coefficient of the analyte and the flow rate of the bulk solution. With full or partial mass transfer, the diffusion from the bulk solution to the interaction surface is slower than the rate of binding of the analyte to the ligand. This will create a shortage of analyte at the interaction surface. Therefore, calculated kinetic constants under mass transfer conditions reflect more the mass transfer rate than the true binding kinetics. The best way to minimize mass transfer is to immobilize less ligand.
The coefficient for mass transfer can be calculated in two different ways. The one without the molecular size of the analyte is kt. The one with the molecular size of the analyte is km. Below are both models. Pay extra attention to the units used.
Mass transfer rate constant
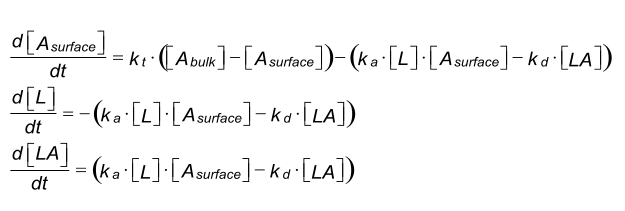
Under mass transfer limitation the diffusion of the analyte (A) from the bulk solution to the surface and the binding to the ligand (L) on the sensor chip can be described as:
Reaction equation
Differential equation - kt
| Parameter | Meaning |
|---|---|
| Abulk | analyte concentration in buffer in M |
| Asurface | analyte concentration as surface of sensorchip in M |
| L | concentration of free ligand in RU |
| LA | concentration of ligand-analyte complex in RU |
| ka | association rate constant in M-1s-1 |
| kd | dissociation rate constant in s-1 |
| kt | coefficient for mass transfer in RU m-1 s-1 |
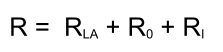
Response calculation
Below an example of a sensorgram generated with the differential equations from above.
| Concentration
(nM) |
ka
(M-1s-1) |
kd
(s-1) |
kt
(RU M-1s-1) |
Rmax
(RU) |
|---|---|---|---|---|
| local | global | global | global | global |
| - | 1.105 | 5.10-3 | 2.107 | 250 |
| 12.5 | ||||
| 25.0 | ||||
| 50.0 | ||||
| 75.0 | ||||
| 100.0 | ||||
Mass transfer coefficient
When the mass of the analyte is know the mass transfer coefficient (km) can be calculated using the next formula. The mass transfer rate is given as the diffusion rate in m s-1(2).
Differential equation - km

| Parameter | Meaning |
|---|---|
| L | concentration of free ligand in RU |
| A | concentration of free analyte in M |
| LA | concentration of ligand-analyte complex in RU |
| ka | association rate constant in M-1s-1 |
| kd | dissociation rate constant in s-1 |
| km | mass transfer constant in m s-1 |
| Mr | molecular mass of analyte in Dalton |
Below an example of a sensorgram generated with the differential equations from above.
| Concentration
(nM) |
ka
(M-1s-1) |
kd
(s-1) |
km
(m-1s-1) |
Rmax
(RU) |
Mr
(Da) |
|---|---|---|---|---|---|
| local | global | global | global | global | global |
| - | 1e5 | 5e-3 | 2e7 | 250 | 50000 |
| 12.5 | |||||
| 25.0 | |||||
| 50.0 | |||||
| 75.0 | |||||
| 100.0 | |||||