Replicates
To create a sound statistical basis of the obtained values, perform experiments and analyses at least in duplicate (1),(2). If the curves overlay, you know that both ligand and analyte are stable in the current experimental setup. Do not believe an interaction curve before you see it at least twice ! (2).
Normally a single experiment contains several injections of the same analyte at various concentrations. In each experiment, there should be replicates to show the stability and reproducibility of the system. Such an experiment will give single ka, kd and KD values with the global fitting routines.
However, even if the obtained parameters appear correct, take some care. The high sampling rate gives a huge amount of data points, which makes the Chi2 relatively insensitive. Furthermore, the automated process of injection and data sampling is optimized to such a high standard that experimental variation in this stage is very small in comparison to the variation introduced by the operator during sample preparation. Analysing one experiment will give one value for the ka, kd and KD. The error value given by the fitting program is the statistical error (3). The error values define how well the parameters in the model fit the curves. For true replication of experiments new samples should be made and run with the same method (4). In addition, for a robust results, replicate experiments, standardize sample preparation, use a wide concentration range (100 fold), inject the samples in a randomized order, include buffer injections, and use double referencing and global analysis in order to avoid systematic errors (5). Moreover, use sensor surfaces with different ligand concentrations or use different immobilization techniques (6). Reverse the analyte and ligand to confirm the results and use other methods to support the results.
Replicates come in several flavours.
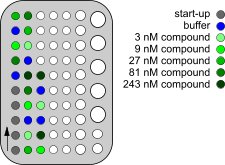
The within-experiment replicate is the injection of an analyte concentration multiple times. These replicates can come from the same vial. However, it is better to have the replicates in separate vials. When the cap of the vial is pierced, evaporation will change the analyte concentration, making the replicates less reproducible. For every analyte concentration, one dilution is made and divided over the replicate vials. If serial dilutions are used, make a constant step dilution, e.g. step 3. Make each next dilution out of the previous dilution and try to use large (> 10 µl) and easy to pipet volumes, minimizing errors. All the replicates with-in one run count as one experiment. Analysing one experiment will give one value for the ka, kd and KD. The error given by the fitting program is the statistical error (2). The value defines how well the parameter in the model fit to the curves. For a real experimental error, the experiment must be repeated.
The experimental replicate is repeating the whole experiment with fresh analyte, preferable a different batch. It is even better to make a new ligand sensor chip surface and repeat the analyte injections. By replicating the interaction, averaging the results and using the standard deviation, a true experimental error is determined.
The system replicate is the reversal of the ligand and analyte proving that the interaction is really between these two interactants. However, this is not always feasible because the analyte is for instance hard to immobilize or the amount of ligand is in shortage.
Analyte injection order
The order of analyte injection can be important. Simply injecting the analyte from low to high concentration can hide problems with regeneration and baseline drift. It is better to inject the analyte concentrations in a randomized manner. This randomisation can be delegated to the machine by using a special command or the user can place the analyte concentrations in random order. The purpose of randomisation is to remove bias and other sources of extraneous variation that are not controllable.
Choose the analyte concentration in a range between 0.1 times and 10 times the KD of the interaction. This will roughly give a response from 10 – 90% of the Rmax. Since it is not necessary to saturate the ligand (3) to get meaningful results, higher analyte concentrations will waste precious sample. Higher analyte concentrations can give rise to non Langmuirian behaviour of the curves. Use a series of at least five injections covering 0.1–10 times the KD and replicate each concentration at least two times (4). The use of capped vials prevents evaporation of solutions and is therefore recommended (5).
In conclusion, for a real robust answer, run experiments in replicate, randomize sample preparation, use a wide concentration range (100 fold), inject the samples in a randomized order, include buffer injections, use double referencing, and global analysis in order to avoid systematic errors (5). Use sensor surfaces with different ligand concentrations or use different immobilization techniques (6). Reverse the analyte and ligand to confirm the results and use other methods to support the results.
References
| (1) | Fischer, R., D. Schumann, S. Zimmermann, et al. Expression and characterization of bispecific single-chain Fv fragments produced in transgenic plants. European Journal of Biochemistry 262: 810-816; (1999). Goto reference |
| (2) | Rich, R. L. and D. G. Myszka The Revolution of Real-Time, Label-Free Biosensor Applications. (2011). Goto reference |
| (3) | Rich, R. L. and D. G. Myszka Grading the commercial optical biosensor literature-Class of 2008: 'The Mighty Binders'. J.Mol.Recognit. 23: 1-64; (2010). Goto reference |
| (4) | Biacore AB Bia Journal Article. (1999). |
| (5) | Cannon, M. J., G. A. Papalia, I. Navratilova, et al. Comparative analyses of a small molecule/enzyme interaction by multiple users of Biacore technology. Analytical Biochemistry 330: 98-113; (2004). |
| (6) | Papalia, G. and D. Myszka Exploring minimal biotinylation conditions for biosensor analysis using capture chips. Analytical.Biochemistry 403: 30-35; (2010). Goto reference |