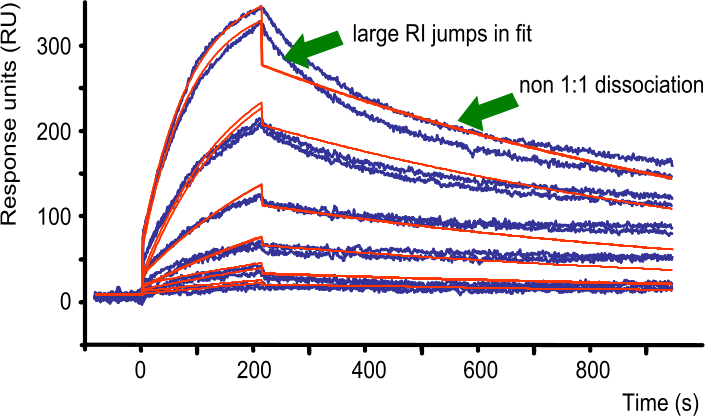
High buffer jump
Sometimes the fitting gives a strange buffer (Refractive Index or RI) jump at the end of the association phase. The same jump is at the beginning but is generally less visible/obvious.
Large calculated RI jumps can originate from bad positioned injection start markers. Especially when the markers are positioned automatically, check if they are at the start of the analyte injection and that there are no spikes or jumps at this point. In addition, curves that have fast association and dissociation rates can have large RI because the model misinterprets the kinetics. It can be beneficial to fit the curves first without any RI to obtain the kinetic constants first and use these as starting values with a fitting with the RI as fitted parameters.
When the analyte concentration is too high (> 100x KD) secondary binding events can be expected and the curves deviate from the 1:1 model. Then the model is using the RI to allow the curve to fit better. When the RI jumps in the fit are large compared to the curve jumps, it means that the model does not fit the data well (1).
Also when the interaction is not 1:1 and the fitting is using a 1:1 model often the RI is used to make the fit 'better'. In these cases it can be seen that the real dissociation is also deviating from the fitting.

References
| (1) | Rich, R. L. and D. G. Myszka - Grading the commercial optical biosensor literature-Class of 2008: 'The Mighty Binders'. J.Mol.Recognit. 23: 1-64; (2010). Goto reference |