One-To-One kinetics
The reaction between immobilized ligand (L) and analyte (A) can be assumed to follow a pseudo first order kinetics (1), (2), (3), (4) when the ligand concentration is constant and the analyte concentration is in excess. Binding occurs between ligand and analyte when they collide due to diffusion, and when the collision has the correct orientation and enough energy. During the association phase the amount of formed complex (LA) increases as a function of time. Once binding has occurred, the ligand and analyte remain bound together for a random amount of time. By replacing the analyte by buffer the analyte concentration drops to zero, a time dependent dissociation follows. After dissociation, the ligand and analyte are the same as they were before binding. If either analyte or ligand is chemically modified, then the binding does not follow the law of mass action. It is assumed that the binding is equivalent en independent for all binding sites (5).
Reaction equation

It is assumed that the flow in the cell is sufficiently high so that there is no depletion or accumulation of analyte in solution and that the analyte concentration remains constant.
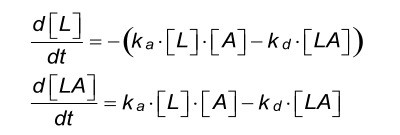
Differential equation
| Parameters | |
|---|---|
| L | concentration of free ligand in RU |
| A | concentration of free analyte in M |
| LA | concentration of ligand-analyte complex in RU |
| ka | association rate constant in M-1s-1 |
| kd | dissociation rate constant in s-1 |
Response calculation
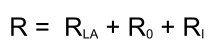
Below an example of a sensorgram generated with the differential equations from above.
| Concentration
(nM) |
ka
(M-1s-1) |
kd
(s-1) |
Rmax
(RU) |
|---|---|---|---|
| local | global | global | global |
| - | 1.105 | 5.10-3 | 250 |
| 12.5 | |||
| 25.0 | |||
| 50.0 | |||
| 75.0 | |||
| 100.0 | |||
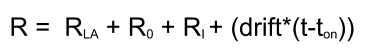
Adding drift
Insufficient equilibrated instruments often see baseline drift after immobilization or a buffer change. In addition, regeneration solutions may cause baseline drift due to high salt contents or by changing the pH of the matrix and the bound ligand. It is better to avoid baseline drift by adding extra equilibration time between the immobilization and the experiment and between experimental cycles.
Adding sufficient wash steps after regeneration, longer equilibration times and blank injections in the measurements can eliminate drift (double referencing).
This model will take positive or negative baseline drift in account. This drift is calculated in the total response and has no influence on the kinetic constants (1) as long as the drift is based on the drift before the analyte injection. Adding drift to the fitting can make the fit better but also can skew the answer (6).
Below an example of a sensorgram generated with the differential equations from above.
| Concentration
(nM) |
ka
(M-1s-1) |
kd
(s-1) |
Rmax
(RU) |
Drift
(RU s-1) |
|---|---|---|---|---|
| local | global | global | global | global |
| - | 1.105 | 5.10-3 | 250 | 0.02 |
| 12.5 | ||||
| 25.0 | ||||
| 50.0 | ||||
| 75.0 | ||||
| 100.0 | ||||
More information about the shape of the curves can be found in the sensorgrams section.
References
| (1) | BIACORE AB - BiaEvaluation 3.0. (1999). |
| (2) | Bjorquist, P. and Bostrom, S. - Determination of the kinetic constants of tissue factor/factor VII/factor VIIA and antithrombin/heparin using surface plasmon resonance. Thrombosis Research 85: 225-236; (1997). |
| (3) | Jonsson, U. et al - Real-time biospecific interaction analysis using surface plasmon resonance and a sensor chip technology. Biotechniques 11: 620-627; (1991). |
| (4) | O'Shannessy, D. J. et al - Determination of rate and equilibrium binding constants for macromolecular interactions using surface plasmon resonance: use of nonlinear least squares analysis methods. Analytical Biochemistry 212: 457-468; (1993). |
| (5) | O'Shannessy, D. J. and Winzor, D. J. - Interpretation of deviations from pseudo-first-order kinetic behavior in the characterization of ligand binding by biosensor technology. Analytical Biochemistry 236: 275-283; (1996). Goto reference |
| (6) | Rich, R. L. et al - A global benchmark study using affinity-based biosensors. Analytical Biochemistry 386: 194-216; (2008). Goto reference |