Please read the tutorial before making the quiz. All the answers are 'hidden' in the text.
After submitting the quiz you will see your results and a comparison with the other results. The quiz has 30 questions and will take 5 - 10 minutes to complete. Read the questions carefully.
You can make the quiz as often as you like.
Success!
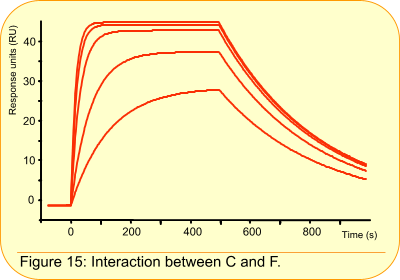
Question 15:
Global parameters
Which parameters should be globally fitted?
A: ka, kd, KD, Rmax
B: ka, kd, Rmax
C: ka, kd, Rmax, RI
D: Rmax, RI, Chi2