This forum is intended for questions about kinetics, Surface Plasmon Resonance and the instruments related to these techniques.
Data fitting to a kinetic experiment
- Amit_Sharma
- Topic Author
- New Member
-

Less
More
- Thank you received: 0
3 years 7 months ago #1
by Amit_Sharma
Data fitting to a kinetic experiment was created by Amit_Sharma
Fitting the attached sensogram using a 1:1 binding model gives an affinity that is ~5x above the expected Kd. The dissociation curve does not seem to fit well. Was wondering if anyone had ideas about the reason for the poor fit of the model. Although, the Chi2 appears to be within 10% of RU(indicator of a good fit?)
Any inputs will be much appreciatd.
thanks
Any inputs will be much appreciatd.
thanks
Please Log in or Create an account to join the conversation.
- Arnoud
- Moderator
-

Less
More
- Thank you received: 0
3 years 7 months ago #2
by Arnoud
Replied by Arnoud on topic Data fitting to a kinetic experiment
The equilibrium dissociation constant (KD) is calculated from the ka and kd. So if you say that the KD is 5x above the expected what were the ka and kd? And how where they measured. So how do the ka and kd from the recent fit compare to the old values?
This can give a clue of where to look for the reason of the differences.
One mayor problem with the association is that there is no curvature in the measurements which means that the ka is poorly defined.
So what are the parameters? ka and kd, calculated Rmax – analyte concentrations , injection times
kind regards
Arnoud
Please Log in or Create an account to join the conversation.
- Amit_Sharma
- Topic Author
- New Member
-
Less
More
- Thank you received: 0
3 years 7 months ago #3
by Amit_Sharma
Replied by Amit_Sharma on topic Data fitting to a kinetic experiment
Thanks for looking at the data and your inputs, Arnoud. The higher affinity(~5x) was obtained using SPR, though the article does not detail the experiment conditions.
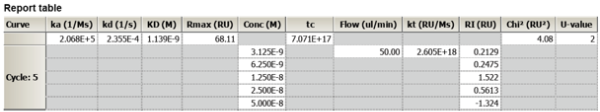
The kinetic parameters of the data are: ka =2.07E-5 M-1s-1, kd = 2.4E-4s-1, and the Rmax=68
 .
.
The concentrations used were 50nM, 25nM, 12.5nM, 6.25nM, 3.125nM, and the contact time was 60s.
Attached is the report table.
Given that the passed all criteria, the residuals were within the 'green lines', and that the Chi2 s within 10% of the RU, would you consider this as publishable?
thanks again
Amit
The kinetic parameters of the data are: ka =2.07E-5 M-1s-1, kd = 2.4E-4s-1, and the Rmax=68
The concentrations used were 50nM, 25nM, 12.5nM, 6.25nM, 3.125nM, and the contact time was 60s.
Attached is the report table.
Given that the passed all criteria, the residuals were within the 'green lines', and that the Chi2 s within 10% of the RU, would you consider this as publishable?
thanks again
Amit
Please Log in or Create an account to join the conversation.
- Arnoud
- Moderator
-
Less
More
- Thank you received: 0
3 years 7 months ago #4
by Arnoud
Replied by Arnoud on topic Data fitting to a kinetic experiment
Hi Amit,
The fact that the authors did not publish the experimental conditions makes me cautious. Did they show a sensorgram? – no? Be very careful to use the values as a reference.
The fitting seems to be correctly done. Still I hold my point that there is no curvature in the association since the injection period is too short. I would advise to repeat the experiment with an association time of 300 seconds minimum.
Kind regards
Arnoud
Please Log in or Create an account to join the conversation.
Moderators: Arnoud, Arnoud