This forum is intended for questions about kinetics, Surface Plasmon Resonance and the instruments related to these techniques.
Questions about SPR Analysis
- TrystynAlxander
- Topic Author
- New Member
-

Less
More
- Thank you received: 0
4 years 11 months ago #1
by TrystynAlxander
Questions about SPR Analysis was created by TrystynAlxander
I apologize for the lack of actual data or details, I'm still waiting on my boss's permission to post any of that, but the following questions are about SPR kinetics experiments and some large gaps in my knowledge for interpreting/analyzing the data.
Referencing.
Do the pre-referenced sensorgrams tell you anything? I often find that my pre-referenced sensorgrams look blocky, or are blocky with a weird downward curvature over the top of the block, or less often a block with an SPR curve on top of it. The blocky-ness does go down with the dilutions, and blanks do not have it, but even the blanks can have weird curvature.
Early on I thought it was buffer mismatch, but I'm not sure that's the case. While I don't always dialyzes into the running buffer, I always have my stocks in a theoretically identical buffer. Plus after the serial dilution using the running buffer it just doesn't make sense that even the low concentrations would still be blocky if it were buffer mismatch. I just have a hard time believing the 1/64 or less difference in the supposedly identical buffers is causing a problem. Even if I was 5mM off that's 0.07mM after the dilutions, sometimes less.
I was also wondering about the curvature and relative signal. I've noticed particularly I think when I have a low Rmax the difference between the reference cell and the ligand cell is small relative to the total signal. With low Rmax, the curvature of the ligand cell doesn't look like an SPR curve. Sometimes the subtraction looks like SPR curve, sometimes it looks like a block, sometimes it looks like something inbetween (an extra steep SPR curve). I don't understand when or why the pre-referenced curves do or don't subtract into good or bad referenced curves.
I can get good blanks, but the pre-referenced sometimes also have weird curvatures too.
Concentration
Notably, when I do get good sensorgrams, the concentrations always look too low. I've never been able to get the concentration correct because I can never get to saturation. The more analyte I add the higher it goes. This leads me to an additional problem. I understand that for kinetics experiments the actual concentration of the analyte doesn't determine the the KD - the rate constants determine the KD and the Rmax determines the concentrations. But, when I use scrubber I always end up with KD's that are higher with high concentrations and lower with low concentrations. I could make the KD whatever I want just by adding more ligand to adjust the Rmax thus adjusting the required concentrations. This is obviously not real, but the inability to get good/reliable curvature is preventing me from making any meaningful measurements.
Again I apologize for the lack of actual data, and I hope to change that in another post, but any insight to the theory of why these issues occur would be greatly appreciated. I've read the book and the website and a number of additional introductory papers, and I've done my best to make my experiments perfect, but I feel like I still have major gaps in my theoretical knowledge.
Please Log in or Create an account to join the conversation.
- Arnoud
- Moderator
-

Less
More
- Thank you received: 0
4 years 11 months ago #2
by Arnoud
Replied by Arnoud on topic Questions about SPR Analysis
Hi,
One figure says more than a thousand words. But I will try to fill the gaps.
Pre-referenced sensorgrams say something about the bulk effect (buffer mismatch) and in case of the reference something about the non-specific binding. Although buffer mismatch is the most common cause of the bulk effect (1 mM = 20 RU) the analyte will also induce some bulk effect. A higher concentration of analyte will give a higher bulk effect etc.
When you have this bulk effect even will low analyte concentrations you should inject the flow buffer directly flow the flow buffer bottle. When the bulk effect persists, it is something from the injection system. In that case thorough cleaning or even replacement of IFC/sensor surface may be necessary to resolve this. In addition, blanks (buffer only) with weird curves indicate that cleaning may be necessary, the buffers are not clean (filter!) or there is build-up of small air bubbles by non-degassed buffer.
When subtract a bad reference curve you only can have a bad result. And the other way around subtracting a 'good' reference from a bad curve will still give you a bad curve. The reference surface has the purpose to subtract the bulk effect and non-specific binding to the surface matrix. It cannot compensate for non-specific binding to the ligand.
To compensate for 'matrix' differences between the reference and ligand surface use the double referencing method ( www.sprpages.nl/experiments/data-processing ).
To get a valid fitting you need at least the curves of two concentrations of analyte. Fitting single curves will lead to erroneous results.
Kind regards
Arnoud
One figure says more than a thousand words. But I will try to fill the gaps.
Pre-referenced sensorgrams say something about the bulk effect (buffer mismatch) and in case of the reference something about the non-specific binding. Although buffer mismatch is the most common cause of the bulk effect (1 mM = 20 RU) the analyte will also induce some bulk effect. A higher concentration of analyte will give a higher bulk effect etc.
When you have this bulk effect even will low analyte concentrations you should inject the flow buffer directly flow the flow buffer bottle. When the bulk effect persists, it is something from the injection system. In that case thorough cleaning or even replacement of IFC/sensor surface may be necessary to resolve this. In addition, blanks (buffer only) with weird curves indicate that cleaning may be necessary, the buffers are not clean (filter!) or there is build-up of small air bubbles by non-degassed buffer.
When subtract a bad reference curve you only can have a bad result. And the other way around subtracting a 'good' reference from a bad curve will still give you a bad curve. The reference surface has the purpose to subtract the bulk effect and non-specific binding to the surface matrix. It cannot compensate for non-specific binding to the ligand.
To compensate for 'matrix' differences between the reference and ligand surface use the double referencing method ( www.sprpages.nl/experiments/data-processing ).
This is generally a sign for non-specific binding. Real kinetics can saturate the ligand. Generally a concentration range of 0.1 – 10 time the KD will cover the range of very low response to 90% of the maximal response. If you get saturation – I rather speak of steady state – because saturation hardly ever is needed depends also on the injection time ( www.sprpages.nl/sensorgram-tutorial/a-curve curve dependencies).The more analyte I add the higher it goes
To get a valid fitting you need at least the curves of two concentrations of analyte. Fitting single curves will lead to erroneous results.
Kind regards
Arnoud
Please Log in or Create an account to join the conversation.
- TrystynAlxander
- Topic Author
- New Member
-
Less
More
- Thank you received: 0
4 years 11 months ago #3
by TrystynAlxander
Replied by TrystynAlxander on topic Questions about SPR Analysis
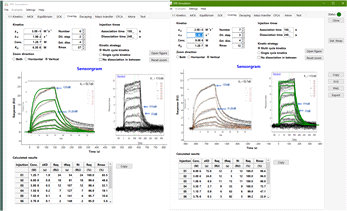
Greetings, I've attached some figures this time, so hopefully they will help explain better.
While I understand the buffer mismatch concern, I get a high response on the reference cell even with dialyzed samples. I guess this is non-specific binding of the sample. I'm not sure what you mean by inject the flow buffer directly from the buffer bottle. I was under the impression the system essentially did that itself by taking it into a syringe then switching the flow path. I clean the machine pretty thoroughly each time before I use it. I also filter all my buffers and samples. I don't de-gas, but I don't think these are nearly large enough changes to be bubbles on the chip surface. Regarding subtracting references, I understand the "garbage in, garbage out" perspective. I'm just not sure what's garbage. Take a look at the attached sensorgrams, you can see that the pre-referenced sensorgrams can be quite weird yet appear to subtract out fine. I'm not sure if this is a matter of scale or some sort of injection-specific drift or what's going on.
More context on the attached sensorgrams. I have have two chips (chip_a and chip_b). Chip A has a high surface density, and I've included two experiments (high concentration and low concentration). I've included different formats to help with analysis. The high concentration doesn't overlap well, so I included a version where it's just a single series. The low concentration has a version with the same axis scale as the high concentration and a zoomed in scale. Chip B has a much much lower surface density because I've been suspecting that many of my issues are due to high surface density. You can see that this chip had much less curvature, but it did saturate (first time I've had that happen). I did some math (also attached) and it seems like the curvature should be independent of the ligand concentration, yet that's clearly not happening here, so I was wondering if this is due to mass transfer? And generally which curve is more trustworthy. I suspect an empirically well defined R_max is required for any reliable analysis, so I'm lean towards the low-density chip (chip b). But, I'd appreciate any insight you could offer.
Regards,
-Tristin.
P.S. Didn't really tell my boss I was posting this, so if you see anything that tells you anything about the specific system pretend it's not there.
Please Log in or Create an account to join the conversation.
- Arnoud
- Moderator
-
Less
More
- Thank you received: 0
4 years 11 months ago #4
by Arnoud
Replied by Arnoud on topic Questions about SPR Analysis
Hi Tristin
In general, when the blank injection has a low curve response after reference subtraction you can use the reference surface and perform the double referencing (= blanked sensorgrams). Besides the negative drift during the injection, reference subtraction seems to work out fine.
Did you check the formulation of the analyte. Are there additives you don't dialyse out which contribute to the bulk effect?
High versus low ligand density. It seems that the high ligand density gives a higher bulk effect and possible extra non-specific interaction (and a non 1:1 interaction profile). This is less marked with the low density surface. It is possible that this effect is causing the problem of the discrepancy of the KD between the low and high density surface. I would go for the low density surface results since you can saturate the ligand which is a good sign.
As a note: In SPR the ligand density in combination with the Mw ratio of the ligand and analyte determines the Rmax. The curvature is determined by the ka and kd. Which part of the curvature is visible depends on the injection period. Low analyte concentrations will take more time to get curvature (and it will be less obvious visible).
Kind regards
Arnoud
Just pipet some buffer from the flow buffer in a vial and direct inject and observe the curve for buffer jumps. It should be very low. In addition, use the last dialysis solution as running buffer because that is exactly the same as the sample buffer.I'm not sure what you mean by inject the flow buffer directly from the buffer bottle
In general, when the blank injection has a low curve response after reference subtraction you can use the reference surface and perform the double referencing (= blanked sensorgrams). Besides the negative drift during the injection, reference subtraction seems to work out fine.
Did you check the formulation of the analyte. Are there additives you don't dialyse out which contribute to the bulk effect?
High versus low ligand density. It seems that the high ligand density gives a higher bulk effect and possible extra non-specific interaction (and a non 1:1 interaction profile). This is less marked with the low density surface. It is possible that this effect is causing the problem of the discrepancy of the KD between the low and high density surface. I would go for the low density surface results since you can saturate the ligand which is a good sign.
As a note: In SPR the ligand density in combination with the Mw ratio of the ligand and analyte determines the Rmax. The curvature is determined by the ka and kd. Which part of the curvature is visible depends on the injection period. Low analyte concentrations will take more time to get curvature (and it will be less obvious visible).
Kind regards
Arnoud
Please Log in or Create an account to join the conversation.
- TrystynAlxander
- Topic Author
- New Member
-
Less
More
- Thank you received: 0
4 years 11 months ago #5
by TrystynAlxander
Replied by TrystynAlxander on topic Questions about SPR Analysis
Greetings and many thanks for your replies!
Ah, you mean blank injections. I do those, they are usually quite low after referencing. Almost always within 5RU of baseline usually less. But is your cleaning/filtering/degasing advice about pre-refenced injections? I clean the system quite thoroughly prior to using it, and I'm very careful about filtering my buffers, so I guess that leaves degassing? I didn't know that was normal for SPR, none of the other users in my lab do that. I vaccum filter the flow buffer, so I can plug the top and leave it in a vaccum for a time. I also need to put my sample tubes under a vaccum prior to injection. How long does degassing last? When I get data in triplicate I usually end up using the machine a full day. Regardless you think the data itself is usable when referenced blanks are low because the bulk effects are successfully being subtracted out, correct?
There shouldn't be any additives from purification that can't be dialyzed out, but the P20 in the SPR buffer might be a problem. When buffer exchanging with a concentrator, I concentrate then dilute with the SPR buffer at least three times. In theory this should be as effective as dialysis, but if the P20 doesn't go through the concentrator then it could build up.
So just to be clear, looking at my data you think these pre-referenced sensorgrams are a problem both in shape and amplitude? And you think the most effective way to address these will be to do a better job matching the buffers to eliminate bulk effects? But this data is still usable since the referenced blanks are good.
Regarding Low vs High Density.
While I'm not really qualified to say, the equations make me think the lack of a reliable R_max is fatal for any SPR experiment. It actually surprises me the KD is only a factor of two off given what I'd predict the R_max would be from the high concentration injections (~100RU), but that is nearly consistent with the program's estimated Rmax for the low concentration injections (37RU).
What's more worrying to me is the change in curvature. You can see I have two comparable analyte concentrations and they are injected over the 150s time period. The math I included suggests the surface density shouldn't have an effect, but particularly for the lower concentration the curvature is quite different. As you mentioned, it also fails to fit in a 1:1 model. I've tried a lot to fix that with little real progress. Given the low density data, I'm guessing that this extra layer on the high-density kinetics is an artifact from the density. I just don't know how to prove it.
This problem gets worse because my boss wants a kinetic fit. If the low density chip is correct and the high density chip causes artifacts, I have to question whether we even can get a kinetic fit. I'm also having a hard time convincing him that it's not valid to take data without a curvature and fit a kinetic model to it. I don't want to publish my low density data with rate constants. He says I need to prove that the rate constants can't be fit by modeling the data adding noise then back calculating. He thinks with a simulation he'll know how far off the rate constants might be. I think he just wants to publish a kinetic fit with +- x% on the rate constants, but I'm not sure it's so simple. Do you know if any simulations like that have been done? Technically the rate constants fit to the data are within the specification of the machine, but the kinetic models clearly don't fit in the second where they're jumping straight to equilibrium. He's just not very receptive to my pointing at the line not overlapping when it goes straight up and yabbering about the residuals.
Maybe I could use the dissociation on the high density chip to get the dissociation constant then back calculate the association constant? I'm not sure if he wants the rates or the fit, but at least then the value would be correct. But if it's not 1:1 how do I know what kd I'm measuring?
Anyway, I really appreciate your SPR advice, so many thanks for taking the time to educate me.
Bests,
-Tristin.
Ah, you mean blank injections. I do those, they are usually quite low after referencing. Almost always within 5RU of baseline usually less. But is your cleaning/filtering/degasing advice about pre-refenced injections? I clean the system quite thoroughly prior to using it, and I'm very careful about filtering my buffers, so I guess that leaves degassing? I didn't know that was normal for SPR, none of the other users in my lab do that. I vaccum filter the flow buffer, so I can plug the top and leave it in a vaccum for a time. I also need to put my sample tubes under a vaccum prior to injection. How long does degassing last? When I get data in triplicate I usually end up using the machine a full day. Regardless you think the data itself is usable when referenced blanks are low because the bulk effects are successfully being subtracted out, correct?
Did you check the formulation of the analyte. Are there additives you don't dialyse out which contribute to the bulk effect?
There shouldn't be any additives from purification that can't be dialyzed out, but the P20 in the SPR buffer might be a problem. When buffer exchanging with a concentrator, I concentrate then dilute with the SPR buffer at least three times. In theory this should be as effective as dialysis, but if the P20 doesn't go through the concentrator then it could build up.
So just to be clear, looking at my data you think these pre-referenced sensorgrams are a problem both in shape and amplitude? And you think the most effective way to address these will be to do a better job matching the buffers to eliminate bulk effects? But this data is still usable since the referenced blanks are good.
Regarding Low vs High Density.
While I'm not really qualified to say, the equations make me think the lack of a reliable R_max is fatal for any SPR experiment. It actually surprises me the KD is only a factor of two off given what I'd predict the R_max would be from the high concentration injections (~100RU), but that is nearly consistent with the program's estimated Rmax for the low concentration injections (37RU).
What's more worrying to me is the change in curvature. You can see I have two comparable analyte concentrations and they are injected over the 150s time period. The math I included suggests the surface density shouldn't have an effect, but particularly for the lower concentration the curvature is quite different. As you mentioned, it also fails to fit in a 1:1 model. I've tried a lot to fix that with little real progress. Given the low density data, I'm guessing that this extra layer on the high-density kinetics is an artifact from the density. I just don't know how to prove it.
This problem gets worse because my boss wants a kinetic fit. If the low density chip is correct and the high density chip causes artifacts, I have to question whether we even can get a kinetic fit. I'm also having a hard time convincing him that it's not valid to take data without a curvature and fit a kinetic model to it. I don't want to publish my low density data with rate constants. He says I need to prove that the rate constants can't be fit by modeling the data adding noise then back calculating. He thinks with a simulation he'll know how far off the rate constants might be. I think he just wants to publish a kinetic fit with +- x% on the rate constants, but I'm not sure it's so simple. Do you know if any simulations like that have been done? Technically the rate constants fit to the data are within the specification of the machine, but the kinetic models clearly don't fit in the second where they're jumping straight to equilibrium. He's just not very receptive to my pointing at the line not overlapping when it goes straight up and yabbering about the residuals.
Maybe I could use the dissociation on the high density chip to get the dissociation constant then back calculate the association constant? I'm not sure if he wants the rates or the fit, but at least then the value would be correct. But if it's not 1:1 how do I know what kd I'm measuring?
Anyway, I really appreciate your SPR advice, so many thanks for taking the time to educate me.
Bests,
-Tristin.
Please Log in or Create an account to join the conversation.
- Arnoud
- Moderator
-
Less
More
- Thank you received: 0
4 years 11 months ago #6
by Arnoud
Replied by Arnoud on topic Questions about SPR Analysis
Hi,
Some answers:
Degassing the flow buffer before the experiment is sufficient (once a day).
You can use the data but you are correct, it is not ideal.
Add the P20 after the buffer exchange. The small difference will be compensated by the reference channel.
The curvature is hard to predict by eye since you are looking at different concentrations and Rmax. Comparing the curvature and say that is something different I would not do. Best way is to model because a model is unbiased and your eye not.
I did some modelling with SPRSimulation ( www.sprpages.nl/spr-simulation ) and the difference is about two fold in KD but the difference in ka and kd is smaller. The dissociation of the high ligand surface looks to be suffering from rebinding during the dissociation which will give a lower KD than really is there.
To make things worse, from one experiment you cannot get a KD with error (see www.sprpages.nl/experiments/reporting-results ). What you need is more than one experiment preferable with different ligand surfaces and different analyte batches. Then you can calculate kinetic parameters with stdev's.
Kind regards
Arnoud
Please Log in or Create an account to join the conversation.
Moderators: Arnoud, Arnoud