This forum is intended for questions about kinetics, Surface Plasmon Resonance and the instruments related to these techniques.
Kinetic titration - data fitting
- sarabjork
- Topic Author
- New Member
-

Less
More
- Thank you received: 0
5 years 2 weeks ago - 5 years 2 weeks ago #1
by sarabjork
Kinetic titration - data fitting was created by sarabjork
I am fairly new to SPR and I've only done single-cycle kinetics or kinetic titration so far.
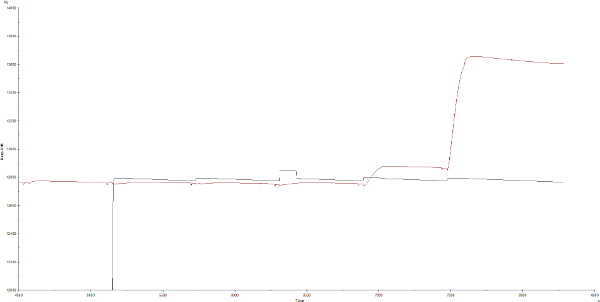
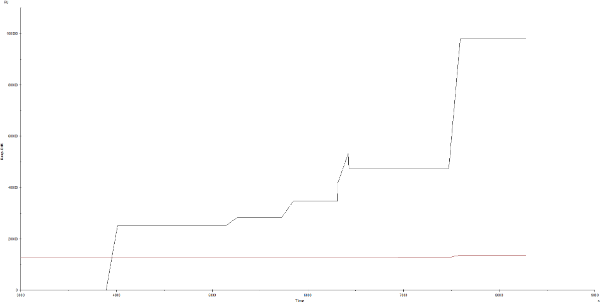
My system has a very low dissociation rate so I am trying to do the short and long method, with 60 µL injections at 30 µL/min, followed by 5 min dissociation time and 30 minute dissociation after the last injection. However, the first time I only waited around 10 min after the last injection. I'm trying to see if I can use the data anyway while running more analysis.
My biggest problem is fitting the data. I'm using the BiaEvaluation 4.1.1. software (newest version from Biacore) and have imported the kinetic titration models from SPR pages: www.sprpages.nl/data-fitting/models/kinetic-titration
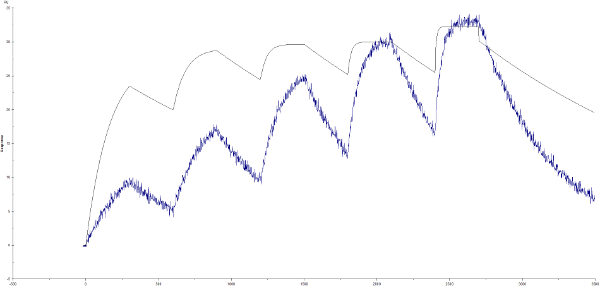
I've also tried creating my own model using the Karlsson et al article from that page. None of the models give me anything remotely close to my curve, sometimes not even close to anything that a curve would look like.
I also tried to use the example data from the zip file to see if it was my data that couldn't be fitted, but I can't get anything close either. Changing the initial values for ka, kd and kt seems to change things sometimes, but the software seems to be randomly creating curves based on that anyway.
What am I doing wrong?
I am not an expert on kinetics and I don't fully understand how the data fitting is done in the software.But the equations in the models do look ok to me. Do I need to create a better model or is there someone out there who has a model that works?
My system has a very low dissociation rate so I am trying to do the short and long method, with 60 µL injections at 30 µL/min, followed by 5 min dissociation time and 30 minute dissociation after the last injection. However, the first time I only waited around 10 min after the last injection. I'm trying to see if I can use the data anyway while running more analysis.
My biggest problem is fitting the data. I'm using the BiaEvaluation 4.1.1. software (newest version from Biacore) and have imported the kinetic titration models from SPR pages: www.sprpages.nl/data-fitting/models/kinetic-titration
I've also tried creating my own model using the Karlsson et al article from that page. None of the models give me anything remotely close to my curve, sometimes not even close to anything that a curve would look like.
I also tried to use the example data from the zip file to see if it was my data that couldn't be fitted, but I can't get anything close either. Changing the initial values for ka, kd and kt seems to change things sometimes, but the software seems to be randomly creating curves based on that anyway.
What am I doing wrong?
I am not an expert on kinetics and I don't fully understand how the data fitting is done in the software.But the equations in the models do look ok to me. Do I need to create a better model or is there someone out there who has a model that works?
Last edit: 5 years 2 weeks ago by sarabjork.
Please Log in or Create an account to join the conversation.
- Arnoud
- Moderator
-

Less
More
- Thank you received: 0
5 years 2 weeks ago #2
by Arnoud
Replied by Arnoud on topic Kinetic titration - data fitting
Hi,
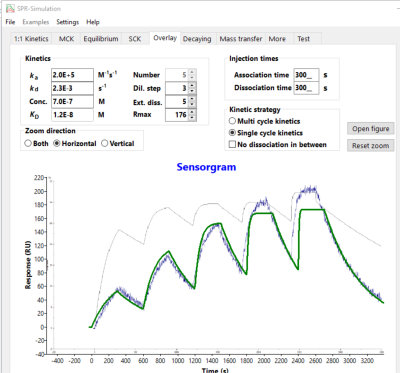
Looking at your last example it seems that you are on the right way. The problem with initial values is always that the model changes the values along the fitting and sometimes it gets stuck in the wrong values. For more insight in the fitting procedure please read the Data fitting section ( www.sprpages.nl/data-fitting ). To get more feeling for the sensorgrams you can read the sensorgrams section and use the BiaSimulation program.
I did some simulations and came up with some possible values ( ka = 2.0E5 M-1s-1; kd = 3.2e-3 s-1; highest conc 7.07e-7 M; dilution step 3x; Rmax 176 RU) which produces a curve close to yours.
Keep in mind that for this kind of fitting the dilution step must be the same between each step. The association and dissociation times also except for the last dissociation.
And the model is 1:1 to when the interaction deviates from 1:1 then you can expect that the fitting is not following the curves.
Kind regards
Arnoud
Please Log in or Create an account to join the conversation.
Moderators: Arnoud, Arnoud