This forum is intended for questions about kinetics, Surface Plasmon Resonance and the instruments related to these techniques.
Lower Binding Affinity than Expected - How to Troubleshoot
- raulu95
- Topic Author
- New Member
-

Less
More
- Thank you received: 0
5 years 5 months ago #1
by raulu95
Lower Binding Affinity than Expected - How to Troubleshoot was created by raulu95
Hello, I am currently evaluating the interaction between a peptide (2 kDa) and protein (40 kDa) using the Biacore T200 on a carboxyl CM5 chip. This experiment was done about 3 years ago by someone else (I have all of their raw data too to confirm) and they received a KD of 300 nM. I repeated the same experiment except using ethylenediamine over ethanolamine (the peptide has a pI of ~10 so wanted to reduce any likelihood of non-specific bonding). I even used the same exact protocol on the Biacore since I have their method files.
I am trying to troubleshoot by comparing the data. Some things that stood out:
-My relative response after EDC/NHS injection was 29 RU, his was 166 RU
-My solvent baseline was significantly higher: 38,000 RU compared to 25,000 RU
-For ligand immobilization, he got 13,000 RU max and 9,000 RU immobilized. For me it was 8,000 max and 5,000 immobilized (my level was still above the threshold I needed based on the Rligand and Rmax equation) but feel free to double check
-We both "immobilized" BSA in the reference cell by injecting at the same concentration as ligand and same conditions. Our peptide can nonspecifically interact with the chip so this seems to help with that. For BSA, his max RU was 12,000 and level immobilized was 11,000 RU. For me, max level was 3000 RU and level immobilized was 2000 RU.
-For analyte injections, his upper concentration achieved a level of 500 RU while my same concentration was more like 150 RU
-Regeneration steps look good for both
-I don't really see nonspecific binding to the BSA channel. There's no increase in RU over the injections so nothing is sticking and, during the analyte injection, there is only a tiny increase in signal ~1-5 RU. This seems to just be slight noise so I'm not fixated on that
Based on this, what do you think the issue could be or what I should think about? Of course there are several possible culprits so I'm a bit overwhelmed trying to think about what I should focus on improving for next time. Unfortunately, the user fee for the instrument is quite high so I cannot really go and optimize the experiment much (luckily it's already pretty well optimized).
I'd be happy to provide any data images if there are any that would help to see. If you think of something I missed, that'd be great if you could suggest other factors to look into or consider. Thanks for your help in advance!
Please Log in or Create an account to join the conversation.
- Arnoud
- Moderator
-

Less
More
- Thank you received: 0
5 years 5 months ago #2
by Arnoud
Replied by Arnoud on topic Lower Binding Affinity than Expected - How to Troubleshoot
HI,
Thank you for the thorough description but what is the question?
The activation is a bit low. I would expect at least 125 RU after a 7 minute standard activation. So use a fresh reagent batch?
Using ethanoldiamine over ethanolamine should not make a difference for your kinetics.
Baseline is dependent on buffer and chip but a new chip should not be that high I think. Did they clean and check the system. You could do a normalize and see if the baseline is lower. In the end al injections are compared to baseline and not to the absolute values, so I see not of a great issue there.
Ligand immobilization is linked to the activation. Less activation is less sites to immobilize.
An analyte injection with a 150 RU level is sufficient. You do not aim for a high signal but for a nice 1:1 curve. We routinely have less than 100 RU as Rmax and go down to 20 RU if necessary. Keep in mind that the binding level does not determine the kinetics but high binding levels can distort the 1:1 binding due to mass transport limitation.
Kind regards
Arnoud
Please Log in or Create an account to join the conversation.
- raulu95
- Topic Author
- New Member
-
Less
More
- Thank you received: 0
5 years 5 months ago #3
by raulu95
Replied by raulu95 on topic Lower Binding Affinity than Expected - How to Troubleshoot
Hi Arnoud,
I don't have a specific question per say but just trying to troubleshoot and figure out what might have gone wrong because I have no idea why this didn't go quite as anticipated.
In terms of activation, what I did was used EDC and NHS prepared at a 0.4 M and 0.1 M, respectively. I diluted them both in water and filtered using a 0.2 um syringe filter. The T200 added them both in equal volumes to an empty tube and mixed.
True, you are probably right that the increased baseline shouldn't really have much of an effect. I know they clean the instrument pretty frequently but did not normalize at the time.
It is odd that I got a low activation. Could it be that a lower immobilization than was achieved in the past could've resulted in a lower KD?
Please Log in or Create an account to join the conversation.
- Arnoud
- Moderator
-
Less
More
- Thank you received: 0
5 years 5 months ago #4
by Arnoud
Replied by Arnoud on topic Lower Binding Affinity than Expected - How to Troubleshoot
Hi,
The immobilization level should not have effect on the kinetics. The immobilization determines the Rmax but also this is not of influence on the kinetics, although high binding levels are prone to mass transfer which will change the kinetics.
All in all, a low immobilization level and a low binding level (Rmax) is better.
Arnoud
Please Log in or Create an account to join the conversation.
- raulu95
- Topic Author
- New Member
-
Less
More
- Thank you received: 0
5 years 5 months ago #5
by raulu95
Replied by raulu95 on topic Lower Binding Affinity than Expected - How to Troubleshoot
I see, thanks for letting me know. I just went through and realized one thing I accidentally did was swapped the concentrations of EDC/NHS. Actually injected 0.4 M NHS/0.1 M EDC (opposite of what's typically recommended I think). Maybe this would explain why a significant portion of injected ligand washed off and wasn't immobilized? Is there a way to tell from the data if you are mass transport limited? Would like to make sure that's not the case here.
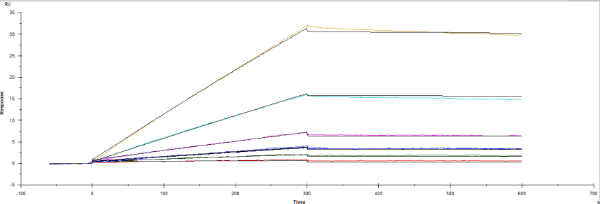
Also, separate experiment but I received these curves that lack curvature. Looks like this has slow dissociation. Should I increase the dissociation time and concentration?
Also, separate experiment but I received these curves that lack curvature. Looks like this has slow dissociation. Should I increase the dissociation time and concentration?
Please Log in or Create an account to join the conversation.
- Arnoud
- Moderator
-
Less
More
- Thank you received: 0
5 years 5 months ago #6
by Arnoud
Replied by Arnoud on topic Lower Binding Affinity than Expected - How to Troubleshoot
Hi,
I suggest you read the following pages
www.sprpages.nl/sensorgram-tutorial/exponential
www.sprpages.nl/experiments/the-experiment
and the senorgram tutorial
www.sprpages.nl/sensorgram-tutorial
The sensorgram you show is definitely mass-transport limited and holds no reliable kinetic data.
Without curvature the association rate constant cannot be determined. For the dissociation look at www.sprpages.nl/kinetics/dissociation
Kind regards
Arnoud
Please Log in or Create an account to join the conversation.
Moderators: Arnoud, Arnoud