This forum is intended for questions about kinetics, Surface Plasmon Resonance and the instruments related to these techniques.
Shouldering association curve
- dineshf
- Topic Author
- New Member
-

Less
More
- Thank you received: 0
5 years 10 months ago #1
by dineshf
Shouldering association curve was created by dineshf
Hello!
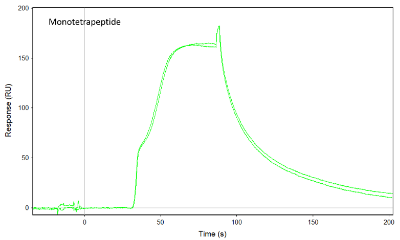
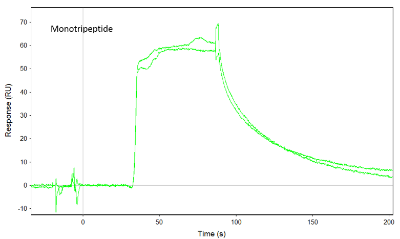
I have a curious question about an SPR trace that looks very strange. I was hoping an expert may be able to give me some ideas about what this could be. This is the trace from a monotetrapeptide analyte onto a biotinylated protein fixed to streptavidin. I do not see this shouldering with the monotripeptide so I'm curious what it may be. Is it a solubility issue? Thanks for any suggestions.
I am running this in 50mM Tris pH 7.5, 150mM NaCl, 3% DMSO. We are using a SensiQ Pioneer.
Analyte(s) at 125uM running at 125uL/min.
Thanks!
Dinesh
Please Log in or Create an account to join the conversation.
- Arnoud
- Moderator
-

Less
More
- Thank you received: 0
5 years 10 months ago #2
by Arnoud
Replied by Arnoud on topic Shouldering association curve
Hi Danesh,
The sensorgram for the monotripeptide jumps immediately to a maximum of about 55 RU. There is no real association curve. Maybe you can titrate the peptide to get both association and dissociation curves.
The monotetrapeptide has more of an association curve. Also try to titrate this peptide and watch if the shouder disappears with lower concentrations. The shoulder could be due to slight DMSO variation between flow buffer and sample dilution. Or originate from differences between reference and active channel.
Arnoud
Please Log in or Create an account to join the conversation.
Moderators: Arnoud, Arnoud