This forum is intended for questions about kinetics, Surface Plasmon Resonance and the instruments related to these techniques.
SPR result analysis BIAcore3000
- Charlesmsa7
- Topic Author
- New Member
-

Less
More
- Thank you received: 0
6 years 2 months ago #1
by Charlesmsa7
SPR result analysis BIAcore3000 was created by Charlesmsa7
Dear everyone,
I am new for the SPR community.
I am using BIAcore 3000 machine for SPR.
I have immobilized my protein on CM5 chip. and analytes are small molecule inhibitors with 5nm to 5uM concentrations.
I have performed two consecutive runs one after the other. I found a large difference in the sensorgram (Results given by the machine at the end of each run).
I am facing trouble in the SPR result analysis also. The values are fitting statistically.
Could not be able to dechiper why the values are not fitting properly as expected. [chi2 values is not below 10% of RU].
I need help in analyzing the files. I have shared the google drive link of all files.
drive.google.com/file/d/13jsg1M9A6THHOF6...RZG/view?usp=sharing
It would be helpful if someone spare their few minutes to help me in analyzing this.
I have included the immobilization sensorgram also.
my email: mkr3j2c1@gmail.com
Thank you in advance
Please Log in or Create an account to join the conversation.
- Arnoud
- Moderator
-

Less
More
- Thank you received: 0
6 years 2 months ago #2
by Arnoud
Replied by Arnoud on topic SPR result analysis BIAcore3000
Dear Charles
First I looked at the automated fittings. I think CSV0C018875 does not bind. The program is making a fit but it makes no sense!
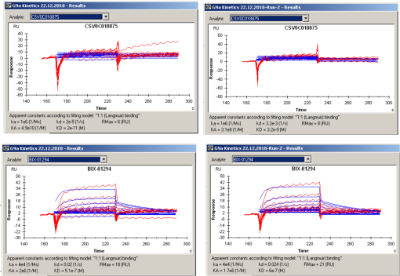
For BIX-01294 you have some response at the highest concentrations. Although both fittings look reasonable well there are some problems especially with the dissociation.
You can notice that there is a bulk parameter (RI) calculated and that the fittings are not following the curves.
In my opinion the two experiments match pretty well thus the system is reproducible. The difference in the numbers is within the normal spread.
I also fitted the curves in a different program and found: ka ~ 1.5e4 M-1s-1; kd ~0.1 – 0.06 s-1 and KD ~4.6 – 6.5 µM which is 10 times lower affinity than reported by the Biacore. It looks that it is mainly by the dissociation rate constant.
Since the interaction is not that strong your analysis can benefit from more data points per curve. Please try a higher sampling rate for the detector (10 Hz).
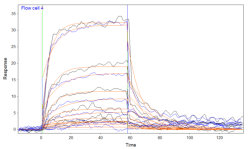
In addition, I also looked at the raw data and I noticed the strange wave in channel 4. That should not be there and can be an indication that you should clean the system. In addition I think that the drift and jumps upon pump stroke and washing are a bit large. Be sure to equilibrate the system very well after immobilisation.
Kind regards
Arnoud
First I looked at the automated fittings. I think CSV0C018875 does not bind. The program is making a fit but it makes no sense!
For BIX-01294 you have some response at the highest concentrations. Although both fittings look reasonable well there are some problems especially with the dissociation.
You can notice that there is a bulk parameter (RI) calculated and that the fittings are not following the curves.
In my opinion the two experiments match pretty well thus the system is reproducible. The difference in the numbers is within the normal spread.
I also fitted the curves in a different program and found: ka ~ 1.5e4 M-1s-1; kd ~0.1 – 0.06 s-1 and KD ~4.6 – 6.5 µM which is 10 times lower affinity than reported by the Biacore. It looks that it is mainly by the dissociation rate constant.
Since the interaction is not that strong your analysis can benefit from more data points per curve. Please try a higher sampling rate for the detector (10 Hz).
In addition, I also looked at the raw data and I noticed the strange wave in channel 4. That should not be there and can be an indication that you should clean the system. In addition I think that the drift and jumps upon pump stroke and washing are a bit large. Be sure to equilibrate the system very well after immobilisation.
Kind regards
Arnoud
Please Log in or Create an account to join the conversation.
Moderators: Arnoud, Arnoud