This forum is intended for questions about kinetics, Surface Plasmon Resonance and the instruments related to these techniques.
SPR curves
- Dana0302
- Topic Author
- New Member
-

Less
More
- Thank you received: 0
6 years 5 months ago #1
by Dana0302
SPR curves was created by Dana0302
Hello.
I'm new here in the forum and have already looked through the other posts, but unfortunately I didn't find what I was looking for.
I have investigated different protein-protein interactions with the SPR and got different curve shapes (three examples are attached, black one).
Is it possible to make statements about the interaction or the binding behaviour of the two proteins only via the shape of the curve? If so, what can the curves tell me and what do they mean?
I would be very happy about an answer!
Thank you very much,
Dana
Please Log in or Create an account to join the conversation.
- Arnoud
- Moderator
-

Less
More
- Thank you received: 0
6 years 5 months ago #2
by Arnoud
Replied by Arnoud on topic SPR curves
Hi,
Welcome to the SPRpages forum.
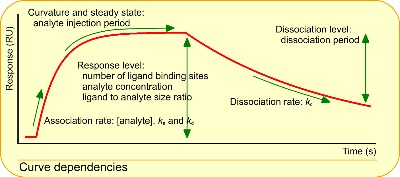
I added a figure with curve dependencies. This figure shows what kind of information is in the curves. Basically it is the association and dissociation rate constant. The equilibrium dissociation constant can be calculated or measured via an equilibrium measurement.
Fitting the curves with a model, the type of interaction (1:1, bivalent) can be determined, but you should be very cautious when using others models. In general, when the curves are not perfect, different models will give an acceptable answer ( www.sprpages.nl/data-fitting/models ) but that is no proof that the interaction is happening.
Looking at the examples you give I would say you have three different interactions strengths. Top: fast dissociation; middle: fast dissociation or bulk; bottom: slow dissociation. For the association one would know the analyte concentrations before you can say anything about the rate.
In general, lower the ligand on the chip. Your response goes to 600 – 1000 RU. Try to get an Rmax of 250 RU Max or even lower.
As a starter follow the sensorgram tutorial ( www.sprpages.nl/sensorgram-tutorial ) and take the quiz.
Kind regards
Arnoud
P.S. the SPRpages book ( www.sprpages.nl/contact-spr-pages/sprpages-book ) is recently updated
Welcome to the SPRpages forum.
I added a figure with curve dependencies. This figure shows what kind of information is in the curves. Basically it is the association and dissociation rate constant. The equilibrium dissociation constant can be calculated or measured via an equilibrium measurement.
Fitting the curves with a model, the type of interaction (1:1, bivalent) can be determined, but you should be very cautious when using others models. In general, when the curves are not perfect, different models will give an acceptable answer ( www.sprpages.nl/data-fitting/models ) but that is no proof that the interaction is happening.
Looking at the examples you give I would say you have three different interactions strengths. Top: fast dissociation; middle: fast dissociation or bulk; bottom: slow dissociation. For the association one would know the analyte concentrations before you can say anything about the rate.
In general, lower the ligand on the chip. Your response goes to 600 – 1000 RU. Try to get an Rmax of 250 RU Max or even lower.
As a starter follow the sensorgram tutorial ( www.sprpages.nl/sensorgram-tutorial ) and take the quiz.
Kind regards
Arnoud
P.S. the SPRpages book ( www.sprpages.nl/contact-spr-pages/sprpages-book ) is recently updated
Please Log in or Create an account to join the conversation.
Moderators: Arnoud, Arnoud