This forum is intended for questions about kinetics, Surface Plasmon Resonance and the instruments related to these techniques.
ProTeon Big Issue
- jsim
- Topic Author
- New Member
-

Less
More
- Thank you received: 0
7 years 2 months ago #1
by jsim
ProTeon Big Issue was created by jsim
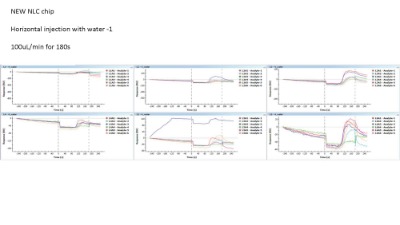
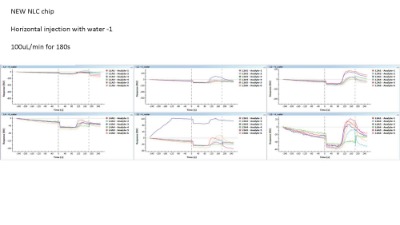
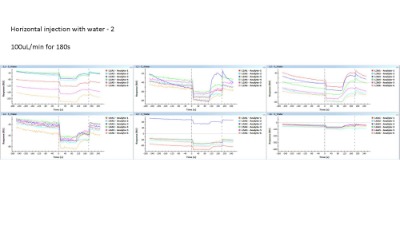
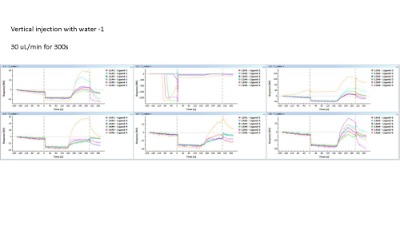
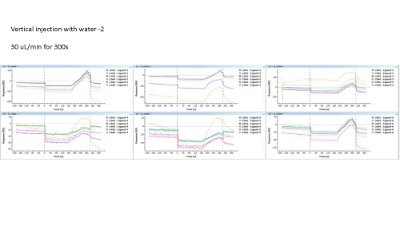
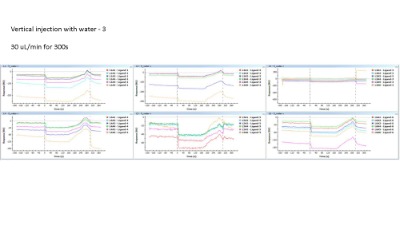
Have you guys encountered this? The Bio-rad technical expert came and told me there is no issue. However, I have just started a new chip, and inject water horizontal (3 times) followed by inject water vertical (3 times). And attached is the profiles i got. There are weird traces .....
I hope someone has the same experience and can tell me what to fix.
I hope someone has the same experience and can tell me what to fix.
Please Log in or Create an account to join the conversation.
- Arnoud
- Moderator
-

Less
More
- Thank you received: 0
7 years 2 months ago #2
by Arnoud
Replied by Arnoud on topic ProTeon Big Issue
Hi,
First, I am not familiar with the ProteOn internal workings but it seems to me that it is in the injection system.
SPR instruments are sometimes sensitive to flow rate differences. It might be the case that the injection system is not running smoothly all the time during the injection and in this way making pressure differences.
With Biacore type of instruments replacing the syringes that deliver the analyte can help.
To get a better understanding of the problem you can inject buffer at the same flow rate for different flow periods (e.g. 1, 2, 3, 4, 5 minutes) and see when the curves (time and injected volume) begin to deviate.
Please post 1 or two bigger graphs so we can see the legends.
Kind regards
Arnoud
Please Log in or Create an account to join the conversation.
Moderators: Arnoud, Arnoud
