This forum is intended for questions about kinetics, Surface Plasmon Resonance and the instruments related to these techniques.
Chi2 value is too high!
- PM
- Topic Author
- New Member
-

Less
More
- Thank you received: 0
6 years 10 months ago #1
by PM
Chi2 value is too high! was created by PM
Hello. manager
Recently, I am developing a method of Affinity binding between Fc gamma receptor and IgG4.
As you know, the binding is known as weak-binding or no-binding.
So I flowed a high concentration analyte, because I wanted to show that even if there is a high concentration anlyte, both do not bind.
But a sensogram and Rmax of the result was pretty ideal.
The problem is a Chi2. It’s was too high and almost same with Rmax.
I think that a problem is from the analyte concentration. Therefore I will flow the lower concentration analyte.
If you have another advice, please let me know
Thank you")
Recently, I am developing a method of Affinity binding between Fc gamma receptor and IgG4.
As you know, the binding is known as weak-binding or no-binding.
So I flowed a high concentration analyte, because I wanted to show that even if there is a high concentration anlyte, both do not bind.
But a sensogram and Rmax of the result was pretty ideal.
The problem is a Chi2. It’s was too high and almost same with Rmax.
I think that a problem is from the analyte concentration. Therefore I will flow the lower concentration analyte.
If you have another advice, please let me know
Thank you
Please Log in or Create an account to join the conversation.
- Arnoud
- Moderator
-

Less
More
- Thank you received: 0
6 years 10 months ago - 6 years 10 months ago #2
by Arnoud
Replied by Arnoud on topic Chi2 value is too high!
Hello,
Your question is not clear to me. You used a high analyte concentration over the ligand and recorded a nice sensorgram. I conclude that there was binding. You performed a fit and the Chi2 is high. Without seeing any sensorgram and fitting, my conclusion is that the fit is not following your curves.
Please post a sensorgram.
Kind regards
Arnoud
Last edit: 6 years 10 months ago by Arnoud.
Please Log in or Create an account to join the conversation.
- PM
- Topic Author
- New Member
-
Less
More
- Thank you received: 0
6 years 10 months ago #3
by PM
Replied by PM on topic Chi2 value is too high!
I am sorry about my deficient explaination.
There is the result.
There is the result.
Please Log in or Create an account to join the conversation.
- Arnoud
- Moderator
-
Less
More
- Thank you received: 0
6 years 10 months ago #4
by Arnoud
Replied by Arnoud on topic Chi2 value is too high!
Hi,
I have used your sensorgram to simulate some curves. Top left sensorgram in the figure is based on the overlay I made over your data. The equilibrium plot shows that with only four points you have almost a straight line. It is highly unlikely that you get an accurate equilibrium dissociation constant from these four points. At the bottom I added three lower analyte concentrations. Now the points form the start of an S-shaped curve and the result will be more accurate.
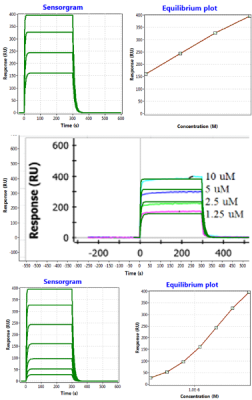
Now for the high Chi2. Because of the relative high response and that the equilibrium points are probably not exactly on the fitted line the residuals and therefore the chi2 is high. If you divide the response values by 10 you will see that the Chi2 wil be lower. I would say two things, lower the ligand concentration to lower the response and use more (lower) analyte concentrations to make a better equilibrium plot.
In addition check www.sprpages.nl/sensorgram-tutorial/a-curve
Kind regards
Arnoud
I have used your sensorgram to simulate some curves. Top left sensorgram in the figure is based on the overlay I made over your data. The equilibrium plot shows that with only four points you have almost a straight line. It is highly unlikely that you get an accurate equilibrium dissociation constant from these four points. At the bottom I added three lower analyte concentrations. Now the points form the start of an S-shaped curve and the result will be more accurate.
Now for the high Chi2. Because of the relative high response and that the equilibrium points are probably not exactly on the fitted line the residuals and therefore the chi2 is high. If you divide the response values by 10 you will see that the Chi2 wil be lower. I would say two things, lower the ligand concentration to lower the response and use more (lower) analyte concentrations to make a better equilibrium plot.
In addition check www.sprpages.nl/sensorgram-tutorial/a-curve
Kind regards
Arnoud
Please Log in or Create an account to join the conversation.
Moderators: Arnoud, Arnoud