This forum is intended for questions about kinetics, Surface Plasmon Resonance and the instruments related to these techniques.
Calculated Rmax
- BIAAU
- Topic Author
- New Member
-

Less
More
- Thank you received: 0
8 years 4 months ago #1
by BIAAU
I would like to know how i check if the graph is fitted correctly for kinetics
concentration range 333.3nM to 20.8nM
MW of analyte 150kDa ligand ~25kDa
The constants obtained from the fit are;
ka kd Rmax KA KD
3.04E+04 0.0163 730 1.87E+06 5.40E-07
now I have a same anlyte (IgG) which gives me similar constants compared to this one except the Rmax is higher, now how can this be?
If they both have similar ka and kd and MW
This calculated RMax from the fitting what does it actually tell me, how do I know it is valid and isn't it supposed to relate to the ka and kd
any insights?
Thank you very much.
I bought the book and a little while ago its great!
Calculated Rmax was created by BIAAU
I would like to know how i check if the graph is fitted correctly for kinetics
concentration range 333.3nM to 20.8nM
MW of analyte 150kDa ligand ~25kDa
The constants obtained from the fit are;
ka kd Rmax KA KD
3.04E+04 0.0163 730 1.87E+06 5.40E-07
now I have a same anlyte (IgG) which gives me similar constants compared to this one except the Rmax is higher, now how can this be?
If they both have similar ka and kd and MW
This calculated RMax from the fitting what does it actually tell me, how do I know it is valid and isn't it supposed to relate to the ka and kd
any insights?
Thank you very much.
I bought the book and a little while ago its great!
Please Log in or Create an account to join the conversation.
- Arnoud
- Moderator
-

Less
More
- Thank you received: 0
8 years 4 months ago - 8 years 4 months ago #2
by Arnoud
Replied by Arnoud on topic Calculated Rmax
The association and dissociation rate constants have no connection to the Rmax. Rmax is determined by the relative molecular weight ratio between ligand and analyte and the amount of immobilized ligand. If the interaction is not 1:1 the Rmax is also determined by the binding stoichiometry.
The theoretical Rmax of a ligand – analyte pair can be calculated ( www.sprpages.nl/immobilization/immobilization-procedures ). Or use the BiaCalculations spreadsheat (see SPR software).
It is a theoretical Rmax since ligand coupling will not render all ligands 100% accessible (and possibly not all analyte molecules will be intact either).
In the fitting procedure Rmax is determined as a fitted (theoretical) parameter that should reflect the amount of complexes formed. The fitting procedure has no knowledge about the individual compound sizes, the amount of immobilized ligand or stoichiometry. So it is a value that fits the best with the fitted kinetic values.
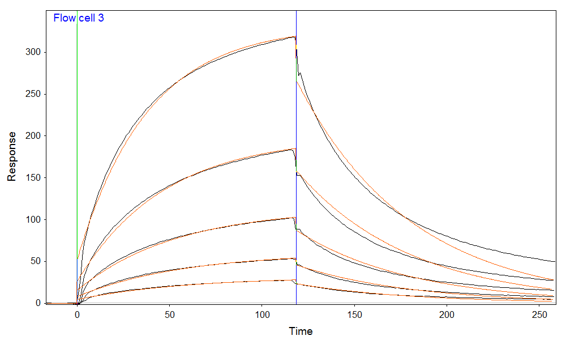
To access if a fitting is correct I take some steps. First I look at the overall fitting. Does is follow the measured data? In your case it looks that the dissociation at higher analyte concentrations is not fitted well. The fitting added slightly too much RI to compensate for this.
At 333 nM the calculated Req is expected to be ~311 RU. The measured Rt (response at end of injection) looks to be close to 300 RU thus that is good. If you look up formula 14.3 in the SPRpages book you will see how Req and Rmax are connected.
In addition it is a good idea to do some extra fittings where you change the initial fitting values by a factor of 5 or 10 and see if the resulting fitting values are converge to the same answer (look-up 'local minimum').
What you observed, are this two separate experiments with the same analyte on the same sensor chip?
What is different to you? I consider a Rmax of 730 ± 20 RU the same between experiments.
Can you show both the sensorgrams with fitting values?
Arnoud
The theoretical Rmax of a ligand – analyte pair can be calculated ( www.sprpages.nl/immobilization/immobilization-procedures ). Or use the BiaCalculations spreadsheat (see SPR software).
It is a theoretical Rmax since ligand coupling will not render all ligands 100% accessible (and possibly not all analyte molecules will be intact either).
In the fitting procedure Rmax is determined as a fitted (theoretical) parameter that should reflect the amount of complexes formed. The fitting procedure has no knowledge about the individual compound sizes, the amount of immobilized ligand or stoichiometry. So it is a value that fits the best with the fitted kinetic values.
To access if a fitting is correct I take some steps. First I look at the overall fitting. Does is follow the measured data? In your case it looks that the dissociation at higher analyte concentrations is not fitted well. The fitting added slightly too much RI to compensate for this.
At 333 nM the calculated Req is expected to be ~311 RU. The measured Rt (response at end of injection) looks to be close to 300 RU thus that is good. If you look up formula 14.3 in the SPRpages book you will see how Req and Rmax are connected.
In addition it is a good idea to do some extra fittings where you change the initial fitting values by a factor of 5 or 10 and see if the resulting fitting values are converge to the same answer (look-up 'local minimum').
What you observed, are this two separate experiments with the same analyte on the same sensor chip?
What is different to you? I consider a Rmax of 730 ± 20 RU the same between experiments.
Can you show both the sensorgrams with fitting values?
Arnoud
Last edit: 8 years 4 months ago by Arnoud.
Please Log in or Create an account to join the conversation.
- BIAAU
- Topic Author
- New Member
-
Less
More
- Thank you received: 0
8 years 3 months ago #3
by BIAAU
Replied by BIAAU on topic Calculated Rmax
Could you please explain how from teh graph At 333 nM the calculated Req is expected to be ~311 RU
I have the equation in the book 14.3
Rt=Req(1-e-(ka*t0)
I tried to calculate it but didn't get 311RU the equation is a bit confusing
also i
I've attached a explain what i mean
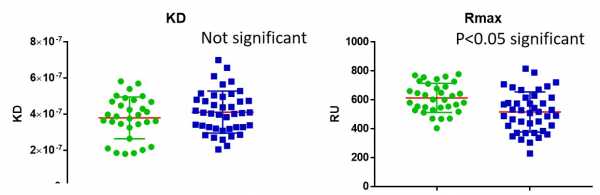
we have 2 groups green and blue
green = IgG (polyclonal) purified from humans with disease A
blue= IgG (polyclonal) purified from humans disease B
MW has been calculated 150kDa for IgG
binding is to a receptor (ligand on chip)
The mean ka and kd are not significant between green and blue groups
but the Rmax is statistically significant
Binding is 1:1
what does it mean for the mean RMax to be significant if the mean kd and ka in the groups is the same, i would of thought it wouldn't be.
i alternate running an IgG from green (5 conc) and then IgG from blue (5 concs)etc to avoid any batch effects, the ligand is the same
could it be that the Rmax is higher for the green group because these samples always run first (5 concs) followed by the blue, so the amount of ligand is less as it gets slowly slowly stripped away with cycles of regeneration or could it be real? (i run a full 96 well plate)by real i mean maybe disease X or Y changes the MW of the IgG (based on the isotypes predominating to binding effect)
ka and kd are always about the same regardless of ligand conc correct?
but the Rmax is ligand conc dependent?
Hope that's clear as mud!
Thanks")
I have the equation in the book 14.3
Rt=Req(1-e-(ka*t0)
I tried to calculate it but didn't get 311RU the equation is a bit confusing
also i
I've attached a explain what i mean
we have 2 groups green and blue
green = IgG (polyclonal) purified from humans with disease A
blue= IgG (polyclonal) purified from humans disease B
MW has been calculated 150kDa for IgG
binding is to a receptor (ligand on chip)
The mean ka and kd are not significant between green and blue groups
but the Rmax is statistically significant
Binding is 1:1
what does it mean for the mean RMax to be significant if the mean kd and ka in the groups is the same, i would of thought it wouldn't be.
i alternate running an IgG from green (5 conc) and then IgG from blue (5 concs)etc to avoid any batch effects, the ligand is the same
could it be that the Rmax is higher for the green group because these samples always run first (5 concs) followed by the blue, so the amount of ligand is less as it gets slowly slowly stripped away with cycles of regeneration or could it be real? (i run a full 96 well plate)by real i mean maybe disease X or Y changes the MW of the IgG (based on the isotypes predominating to binding effect)
ka and kd are always about the same regardless of ligand conc correct?
but the Rmax is ligand conc dependent?
Hope that's clear as mud!
Thanks
Please Log in or Create an account to join the conversation.
- BIAAU
- Topic Author
- New Member
-
Less
More
- Thank you received: 0
8 years 3 months ago #4
by BIAAU
Replied by BIAAU on topic Calculated Rmax
I forgot to add the fitting procedure Rmax
should it be always higher than your RU response of your highest analyte concentration at the end of the injection (stop)to be valid for 1:1? what about bivalent? the Rmax is often lower than my respone at time at injection stop
I do kinetics with 1 min or 2 min injection times as i can't use that much analyte up
do you really need to use 10x the KD conc for kinetics? i have 96 cycles (whole plate) to test on a ligand so i coat quite high 600RU-1000RU (i am regenerating each cycle) and use low concentrations 160nM (the KD is 80mM) i dont see mass transport effects, would there be any problem with this.
I thought 10x KD range is for affinity
Thanks again!
Please Log in or Create an account to join the conversation.
- Arnoud
- Moderator
-
Less
More
- Thank you received: 0
8 years 3 months ago - 8 years 3 months ago #5
by Arnoud
Replied by Arnoud on topic Calculated Rmax
I meant the following formula (sorry for the confusion
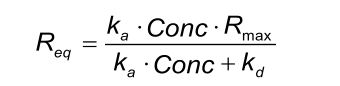
As you can see, the theoretical Rmax can be calculated from the kinetic rate constants, the Rmax and the analyte concentration. Within one experiment, only the analyte concentration is changing, thus for each analyte concentration the corresponding Req can be calculated.
In addition, when you have a fit, the fitted kinetic constants and the Rmax can be used in the formula. Using the fitted values you provided I calculate:
Req = ((3.04 104 x 333 10-9) / (3.0 104 x 333 10-9 + 1.63 10-2)) x 730 = 280 (I used 780 in my previous post which gives 299 RU; sorry).
Thus, the kinetic constants and the Rmax are consistent with the observed curves (the calculations do not take into account the bulk shift which is present in the curves).
If you have a very different Rmax (say 1000 RU) the calculated Req will be very different from the measured Req indicating that the fit is not valid (Rmax: 1000 RU will givee Req: 383 RU).
Then the short questions:
Req is dependent on the Rmax, kinetic constants AND the analyte concentration.
The Rmax should be higher (or equal by full ligand saturation) than the measured curves. This is logic because the Rmax is the maximal response that can be measured with a certain ligand-analyte pair. If a 1:1 fitting is reporting an Rmax lower than the highest analyte concentration, something is wrong. The same applies to the bivalent model.
Judging on the sensorgram you posted earlier the amount of ligand you immobilize could be lower (say down to 300 RU). This will make the curves more 1:1. You don't need a high response to get meaningful results. Lower is better.
Concerning the way you try to compare the two types of IgG, I don't know I can help you since this kind of comparison is not my field. I come back to that.
Arnoud
As you can see, the theoretical Rmax can be calculated from the kinetic rate constants, the Rmax and the analyte concentration. Within one experiment, only the analyte concentration is changing, thus for each analyte concentration the corresponding Req can be calculated.
In addition, when you have a fit, the fitted kinetic constants and the Rmax can be used in the formula. Using the fitted values you provided I calculate:
Req = ((3.04 104 x 333 10-9) / (3.0 104 x 333 10-9 + 1.63 10-2)) x 730 = 280 (I used 780 in my previous post which gives 299 RU; sorry).
Thus, the kinetic constants and the Rmax are consistent with the observed curves (the calculations do not take into account the bulk shift which is present in the curves).
If you have a very different Rmax (say 1000 RU) the calculated Req will be very different from the measured Req indicating that the fit is not valid (Rmax: 1000 RU will givee Req: 383 RU).
Then the short questions:
: YES; however I don't like to speak about a ligand concentration and prefer the amount of ligand immobilized (in RU). This is because it is difficult to determine the actual concentration of the ligand (e.g. in mg/ml or M) on the chip. In addition, the actual ligand concentration is not important in a 1:1 fitting.ka and kd are always about the same regardless of ligand conc correct?
: NO (Yes); Rmax is dependent on the amount of ligand on the sensor chip and the relative size differences between ligand and analyte. But the Rmax is not a kinetic constant nor a specific parameter between two interactants. A fitting uses the Rmax to scale the fitted curves such that they overlay the measured curves (together with the ka, kd and the analyte concnetrations)but the Rmax is ligand conc dependent?
Req is dependent on the Rmax, kinetic constants AND the analyte concentration.
The Rmax should be higher (or equal by full ligand saturation) than the measured curves. This is logic because the Rmax is the maximal response that can be measured with a certain ligand-analyte pair. If a 1:1 fitting is reporting an Rmax lower than the highest analyte concentration, something is wrong. The same applies to the bivalent model.
Judging on the sensorgram you posted earlier the amount of ligand you immobilize could be lower (say down to 300 RU). This will make the curves more 1:1. You don't need a high response to get meaningful results. Lower is better.
To do a fitting that has a high probability to give back reliable values (for ka, kd and/or KD) I would use analyte concentrations between 0.1 – 10 x KD of the interaction. If analyte is limiting you could use lower concentrations. Please look up the 'equilibrium fitting' figure in the SPRpages book for an example.I thought 10x KD range is for affinity.
Concerning the way you try to compare the two types of IgG, I don't know I can help you since this kind of comparison is not my field. I come back to that.
Arnoud
Last edit: 8 years 3 months ago by Arnoud. Reason: clarification
Please Log in or Create an account to join the conversation.
Moderators: Arnoud, Arnoud