This forum is intended for questions about kinetics, Surface Plasmon Resonance and the instruments related to these techniques.
Can I fitting curve using langmuir isotherm without Keq?
- Koreanraichu
- Topic Author
- New Member
-

Less
More
- Thank you received: 0
7 years 7 months ago #1
by Koreanraichu
Can I fitting curve using langmuir isotherm without Keq? was created by Koreanraichu
(Keq=equilibrium constant)
as you know, Langmuir isotherm is Qe=Qmax*Keq*C/1+Keq*C
for linear plot, use 1/Qe=1/Qmax*C*Keq+1/Qmax. (I don't know where is Y intercept... Actually, I didn't know how can I write 절편(intercept) in english, too :dry: )
but I run experiment with DNA, I cannot know equilibrium constant. (I use DNA with 3' CY3 for flowing analyte but CY3 not binds to DNA, so I exclude it)
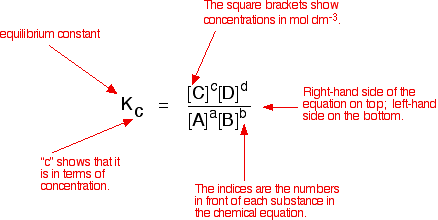
Equilibrium constant formula is this(below).
but In DNA... How can I calculate equilibrium constant? and can I fit date using Langmuir isotherm if I don't know equilibrium constant of DNA?
Please Log in or Create an account to join the conversation.
- Arnoud
- Moderator
-

Less
More
- Thank you received: 0
7 years 7 months ago - 7 years 7 months ago #2
by Arnoud
Replied by Arnoud on topic Can I fitting curve using langmuir isotherm without Keq?
Hi,
Starting with the first equation you mention, I rewrite it to the more commonly used in the SPR community:
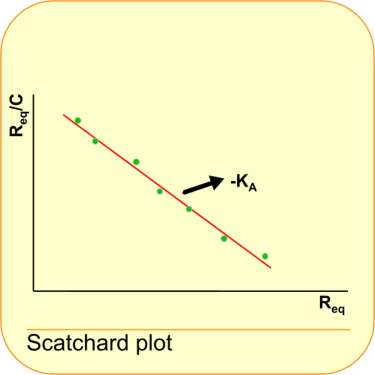
This is the equation that is used in the Scatchard plot (1).
Thus by plotting Req/C against Req the slope of the line is equal to -KA. The intercept with the x-axis is Rmax.
Normally you expect the linearization to be something like y = ax + b. In this case it is y = -ax –b.
Here we get –KA the association constant which is not commonly used because it has the unit M-1. The equilibrium dissociation constant KD in M is preferred (2).
I think the whole purpose of SPR measurements is to measure association and dissociation rates of interactions in the form of response curves. From the curves the association (ka) and dissociation (kd) rate constants are fitted/calculated and the equilibrium dissociation constant (KD) is calculated. During the fitting the Rmax of the whole system and the Req per analyte concentration is calculated.
If the equilibrium responses are measured, an equilibrium fit can be done which will give you only the equilibrium dissociation constant.
Looked for some publication about analysing DNA-DNA interaction but found not much.
This one is a little complicated but describes well how to analyse the interaction (3).
This is an old study which uses equilibrium analysis (4).
1. Kortt, A. A., Nice, E. and Gruen, L. C.; Analysis of the binding of the Fab fragment of monoclonal antibody NC10 to influenza virus N9 neuraminidase from tern and whale using the BIAcore biosensor: effect of immobilization level and flow rate on kinetic analysis. Analytical Biochemistry (273) 1: 133-141; 1999.
2. Palau, W. and Di Primo, C.; Single-cycle kinetic analysis of ternary DNA complexes by surface plasmon resonance on a decaying surface. Biochimie (94) 9: 1891-1899; 2012.
3. Rich, R. L. and Myszka, D. G.; Grading the commercial optical biosensor literature-Class of 2008: 'The Mighty Binders'. J.Mol.Recognit. (23) 1: 1-64; 2010.
4. Yu, F., Yao, D. and Knoll, W.; Oligonucleotide hybridization studied by a surface plasmon diffraction sensor (SPDS). Nucleic Acids Res. (32) 9: e75; 2004.
Last edit: 7 years 7 months ago by Arnoud.
Please Log in or Create an account to join the conversation.
Moderators: Arnoud, Arnoud


