This forum is intended for questions about kinetics, Surface Plasmon Resonance and the instruments related to these techniques.
Biacore Rmax vs RelResp
- BIAAU
- Topic Author
- New Member
-

Less
More
- Thank you received: 0
8 years 8 months ago #1
by BIAAU
Biacore Rmax vs RelResp was created by BIAAU
whats the diffrence between the RelResp (obtained on Biacore3000) from the report table and the sensogram vs the Rmax calculated from the curve fitting.
we dilute the analyte 5 fold and oviously teh RelResp varies and decreases with analyte conc
we see a significant difference between two groups. Treament gives higher RelResp mean vs placebo
But the Rmax reported after curve fitting the placebo Rmax is significant over the treatment which is the opposite
Fitting: Bivalent model
Analyte = antibody (vaccinated or placebo)
ligand = Fc recptor
SA chip with bioinylated ligand
Can the the second association rate constant (ka2) in RU.s-1 can be converted to M-1s-1 with the formula on your website for SA chips or is this only for CM5
Thanks very much.
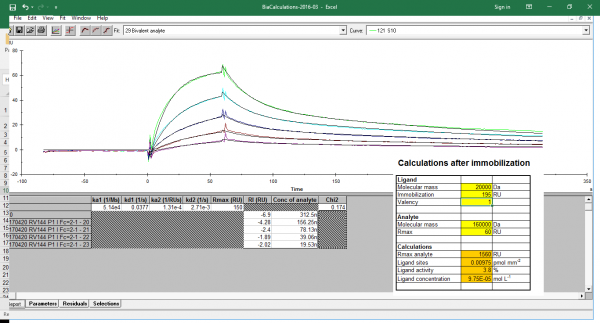
I've attached an e.g kinetic plot and the binding response i observed
ligand activity seems very low
I coated 195RU ligand (20kDa) and observed ~60RU for a 312.5nM analyte (160kDa)
we dilute the analyte 5 fold and oviously teh RelResp varies and decreases with analyte conc
we see a significant difference between two groups. Treament gives higher RelResp mean vs placebo
But the Rmax reported after curve fitting the placebo Rmax is significant over the treatment which is the opposite
Fitting: Bivalent model
Analyte = antibody (vaccinated or placebo)
ligand = Fc recptor
SA chip with bioinylated ligand
Can the the second association rate constant (ka2) in RU.s-1 can be converted to M-1s-1 with the formula on your website for SA chips or is this only for CM5
Thanks very much.
I've attached an e.g kinetic plot and the binding response i observed
ligand activity seems very low
I coated 195RU ligand (20kDa) and observed ~60RU for a 312.5nM analyte (160kDa)
Please Log in or Create an account to join the conversation.
- Arnoud
- Moderator
-

Less
More
- Thank you received: 0
8 years 8 months ago #2
by Arnoud
Replied by Arnoud on topic Biacore Rmax vs RelResp
Hi
Welcome to the forum.
I think you mean the relative response after ligand immobilization. The relative response from the report point table is the response after immobilization (see www.sprpages.nl/immobilization/immobilization-procedures/amine ; point 7 minus point 3). Thus the amount of ligand that is immobilized on the sensor chip in RU. Theoretically the Rmax can be calculated from the amount of immobilized ligand and used analyte as you show in the inset of the figure you posted. The point is, this will only hold for a 1:1 interaction where all the ligand molecules are functional and accessible. All immobilizations will result is a fraction of ligand that is not functional anymore and the Rmax will be lower.
Also in the case of biotinylation of the ligand there is a possibility that a fraction is biotinylated on the functional binding site.
The next thing is that you use an antibody as an analyte. Choosing the bivalent model is a good thing but there are some problems that are difficult to resolve. An antibody can be bound to the surface by one or two arms and still give the same response. If all antibodies bind by two arms the theoretical Rmax should be divided by 2 (or set the valency at 0.5). If all antibodies bind by one arm the Rmax can be reached. The actual calculated Rmax during fitting will be probably somewhere in between and depends on the actual ligand density of the sensor chip.
I think you can convert the ka2 to M-1s-1 because I think that the SA chip is a modified CM5 chip. However, be careful with ka2 since it is (probably) dependent on the ligand density.
From the figure you posted the numbers are hard to read. What you can do is to simulate the curves with different analyte concentrations (maybe inject for two minutes to get some steady state) to see how the theoretical curves should look like.
Kind regards
Arnoud
Welcome to the forum.
I think you mean the relative response after ligand immobilization. The relative response from the report point table is the response after immobilization (see www.sprpages.nl/immobilization/immobilization-procedures/amine ; point 7 minus point 3). Thus the amount of ligand that is immobilized on the sensor chip in RU. Theoretically the Rmax can be calculated from the amount of immobilized ligand and used analyte as you show in the inset of the figure you posted. The point is, this will only hold for a 1:1 interaction where all the ligand molecules are functional and accessible. All immobilizations will result is a fraction of ligand that is not functional anymore and the Rmax will be lower.
Also in the case of biotinylation of the ligand there is a possibility that a fraction is biotinylated on the functional binding site.
The next thing is that you use an antibody as an analyte. Choosing the bivalent model is a good thing but there are some problems that are difficult to resolve. An antibody can be bound to the surface by one or two arms and still give the same response. If all antibodies bind by two arms the theoretical Rmax should be divided by 2 (or set the valency at 0.5). If all antibodies bind by one arm the Rmax can be reached. The actual calculated Rmax during fitting will be probably somewhere in between and depends on the actual ligand density of the sensor chip.
I think you can convert the ka2 to M-1s-1 because I think that the SA chip is a modified CM5 chip. However, be careful with ka2 since it is (probably) dependent on the ligand density.
Not sure what you want to say/ask.we see a significant difference between two groups. Treament gives higher RelResp mean vs placebo
But the Rmax reported after curve fitting the placebo Rmax is significant over the treatment which is the opposite
From the figure you posted the numbers are hard to read. What you can do is to simulate the curves with different analyte concentrations (maybe inject for two minutes to get some steady state) to see how the theoretical curves should look like.
Kind regards
Arnoud
Please Log in or Create an account to join the conversation.
Moderators: Arnoud, Arnoud