This forum is intended for questions about kinetics, Surface Plasmon Resonance and the instruments related to these techniques.
Binding curves for monoclonal antibodies
- creativebiolabs
- Topic Author
- Offline
- New Member
-

Less
More
- Posts: 6
- Thank you received: 1
8 years 2 months ago #1
by creativebiolabs
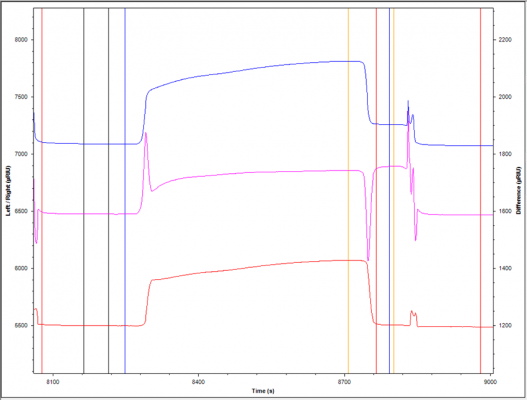
I'm relatively new to working with monoclonal antibodies on SPR. I have immobilized antigen on one channel (test channel) and the reference channel is blank. I've injected a monoclonal antibody over both channels. The test channel is shown in blue, the reference channel in red, and the corrected channel (test channel-reference channel) in pink. Looking at the corrected channel, I appear to have binding. However, when I look at the blank reference channel (red), I'm confused as to why it has a very similar curve to the test channel -- is this an acceptable curve for a monoclonal antibody? I inject quite a lot of antibody (300 µg/ml, 10 µl/min, 7.5 min) and am used to a more obvious binding by monoclonal antibodies. Could it be a problem of too much antibody? Is it just a difference in buffer? Thanks for any tips!
Binding curves for monoclonal antibodies was created by creativebiolabs
I'm relatively new to working with monoclonal antibodies on SPR. I have immobilized antigen on one channel (test channel) and the reference channel is blank. I've injected a monoclonal antibody over both channels. The test channel is shown in blue, the reference channel in red, and the corrected channel (test channel-reference channel) in pink. Looking at the corrected channel, I appear to have binding. However, when I look at the blank reference channel (red), I'm confused as to why it has a very similar curve to the test channel -- is this an acceptable curve for a monoclonal antibody? I inject quite a lot of antibody (300 µg/ml, 10 µl/min, 7.5 min) and am used to a more obvious binding by monoclonal antibodies. Could it be a problem of too much antibody? Is it just a difference in buffer? Thanks for any tips!
Please Log in or Create an account to join the conversation.
- Arnoud
- Moderator
-

Less
More
- Thank you received: 0
8 years 2 months ago #2
by Arnoud
Replied by Arnoud on topic Binding curves for monoclonal antibodies
Hi Jenna,
When I calculate the concentration of the antibody (0.3 mg/ml / 150.000 Da) I come to 2 µM. This is quite high in my opinion. Antibodies with proper affinity should give high responses between 0.1 - 100 nM.
Most of the signal you see is bulk effect (either by buffer mismatch or by antibody concentration). When you can lower this bulk effect the peak and through at the begiing and end will also be less (or disappear).
It looks if there is binding but first get your conditions right.
I would change the flow rate to at least 30 µl/min. If the antibody is strong a 3 min injection should be ok. You may wish to read www.sprpages.nl/experiments/the-experiment
kind regards
Arnoud
Please Log in or Create an account to join the conversation.
- creativebiolabs
- Topic Author
- Offline
- New Member
-
Less
More
- Posts: 6
- Thank you received: 1
8 years 1 month ago #3
by creativebiolabs
Replied by creativebiolabs on topic Binding curves for monoclonal antibodies
Hi Arnoud,
Thanks! I've tried reducing the amount of immobilized antigen (ca 200 RU) and injecting approximately 1 and 10 nM mAb at different flow rates but I'm still seeing a similar problem in that the reference line (red) "follows" or mimics the test line (blue). The system is clean -- is this an indication that there is still too much antibody? Of mass transport effects?
I'm unsure of how to proceed in terms of optimizing this assay, especially since many of the similar publications use relatively high concentrations (even 150 µg/ml) antibodies for epitope tagging.
Thanks again,
Best
Jenna
Please Log in or Create an account to join the conversation.
- Arnoud
- Moderator
-
Less
More
- Thank you received: 0
8 years 1 month ago #4
by Arnoud
Replied by Arnoud on topic Binding curves for monoclonal antibodies
I am not sure what is going on. Several possibilities come to my mind.
1) The antibody is binding non-specifically to the sensor surface, hence almost identical curves.
2) The reference cell also contains your ligand. Since I am not familiar with your instrument I cannot give much comment on it. I know from Biacore type of instruments than when the sealing is not perfect there can be overflow between channels.
3) What happens when you inject an antibody that should not bind? Is there non-specific binding? The page: www.sprpages.nl/experiments/troubleshooting contains some suggestions to counteract non-specific binding.
Kind regards
Arnoud
Please Log in or Create an account to join the conversation.
Moderators: Arnoud, Arnoud