This forum is intended for questions about kinetics, Surface Plasmon Resonance and the instruments related to these techniques.
uniform dissociation
- lee
- Topic Author
- New Member
-

Less
More
- Thank you received: 0
8 years 11 months ago #1
by lee
uniform dissociation was created by lee
Dear All,
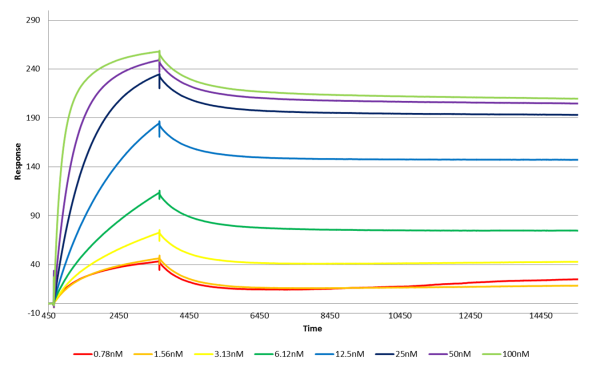
I am new to SPR but recently i have ran some SPR experiments with antibody as analyte. The sensorgrams are looking fine but i dont understand why the dissociation profiles are all the same with all concentrations. so can anyone help me to explain what i am actually seeing here.
regards
lee
I am new to SPR but recently i have ran some SPR experiments with antibody as analyte. The sensorgrams are looking fine but i dont understand why the dissociation profiles are all the same with all concentrations. so can anyone help me to explain what i am actually seeing here.
regards
lee
Please Log in or Create an account to join the conversation.
- Arnoud
- Moderator
-

Less
More
- Thank you received: 0
8 years 11 months ago - 8 years 11 months ago #2
by Arnoud
Replied by Arnoud on topic uniform dissociation
Hi Lee,
The first thing that you can see in the dissociation that it is a little biphasic. Just after the analyte injection end, there is a faster dissociation and then the dissociation levels off (almost stops).
Since the dissociation rate is very low (< 1.0 e-5 s-1) all the lines seem to run parallel. With a dissociation rate of 1.0 e-5 s-1 the complex half-life is more than 19 hours. In this case I would choose for the ‘short & long’ injections ( www.sprpages.nl/experiments/strategy ).
The red curve looks a little odd because there seems to be some drift in the line and the curve seems to follow the light brown curve. Maybe there is a referencing problem?
The analyte concentrations range look well chosen because the curves are well spaced and the association seems to saturate the ligand. However, what is missing is a duplo to show that the system is reproducible.
All in all this looks a strong interaction (very low dissociation rate).
If possible you can try to make a new ligand surface with less ligand in order to try to lower the biphasic behaviour of the system. I would try to get a Rmax below 25 RU.
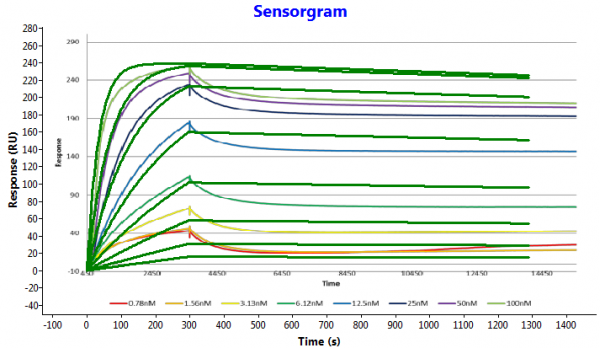
To show that the dissociation curves become almost parallel I simulated the kinetics and made an overlay over your data. To learn how to do that, please go to www.sprpages.nl/spr-simulation .
Kind regards
Arnoud
The first thing that you can see in the dissociation that it is a little biphasic. Just after the analyte injection end, there is a faster dissociation and then the dissociation levels off (almost stops).
Since the dissociation rate is very low (< 1.0 e-5 s-1) all the lines seem to run parallel. With a dissociation rate of 1.0 e-5 s-1 the complex half-life is more than 19 hours. In this case I would choose for the ‘short & long’ injections ( www.sprpages.nl/experiments/strategy ).
The red curve looks a little odd because there seems to be some drift in the line and the curve seems to follow the light brown curve. Maybe there is a referencing problem?
The analyte concentrations range look well chosen because the curves are well spaced and the association seems to saturate the ligand. However, what is missing is a duplo to show that the system is reproducible.
All in all this looks a strong interaction (very low dissociation rate).
If possible you can try to make a new ligand surface with less ligand in order to try to lower the biphasic behaviour of the system. I would try to get a Rmax below 25 RU.
To show that the dissociation curves become almost parallel I simulated the kinetics and made an overlay over your data. To learn how to do that, please go to www.sprpages.nl/spr-simulation .
Kind regards
Arnoud
Last edit: 8 years 11 months ago by Arnoud.
Please Log in or Create an account to join the conversation.
- lee
- Topic Author
- New Member
-
Less
More
- Thank you received: 0
8 years 11 months ago #3
by lee
Replied by lee on topic uniform dissociation
Hi Arnoud,
yes, i have noticed this biphasic dissociation. do you have any idea what might be happening to cause this phenomenal.
this was one of the first attempts i did with this protein so i will try lower the RU and the short & long injection method as suggested.
thank you very much for your suggestions and the link of the simulation.
regards
lee
Please Log in or Create an account to join the conversation.
- Arnoud
- Moderator
-
Less
More
- Thank you received: 0
8 years 11 months ago - 8 years 11 months ago #4
by Arnoud
Replied by Arnoud on topic uniform dissociation
Hi Lee,
Biphasic responses are said to consist of a strong and a weak interaction. At low analyte concentrations and low ligand densities the binding is close to a 1:1 interaction, but at higher analyte concentrations the analyte starts to bind to the weak interaction sites giving rise to a biphasic curve. Because a biphasic response can be described equally well by different models (1), it is virtually impossible to solve the interaction mechanism by modelling alone. Instead of trying to fit biphasic curves, it is recommended to optimize the experimental parameters for the interaction by lowering both the functional ligand density and the analyte concentration. Potential sources of a biphasic interaction are the random immobilization of for instance the amine coupling, impure ligand or analyte. Therefore, check the ligand and analyte if both have a single band on a PAGE-gel. If possible, try a different immobilization technique to lower the random immobilization or reverse ligand and analyte on the sensor chip. In addition, use a ligand density that will give an analyte response close or below 100 RU.
When using an antibody as analyte the kinetics follow a bivalent interaction since the antibody has two identical binding arms. Although the choice of the model follows from the nature of the analyte, the resulting values are difficult to interpret due to the nature of the interaction. Depending on the ligand density and analyte concentration one antibody can occupy one or two ligands.
The Biacore model for the bivalent interaction calculates two pairs of kinetic constants. The first pair gives the association and dissociation rate constants of the first binding and is interpreted as if there was a 1:1 interaction. With the second pair however, the association rate constant is expressed in RU-1s-1 meaning that there is dependency on the amount of bound antibody. This value is not easily converted to a ‘normal’ kinetic rate constant.
There a several attempt made to model bivalent and biphasic interactions (2-4) but without extensive experiments it is very difficult to get meaningful kinetic values for both interactions.
1. Rich, R. L. and Myszka, D. G.; Survey of the year 2007 commercial optical biosensor literature. J.Mol.Recognit. (21) 6: 355-400; 2008.
2. Tiwari, P. B., Üren, A., He, J., et al.; Note: Model identification and analysis of bivalent analyte surface plasmon resonance data. Review of Scientific Instruments (86) 10: 106107; 2015.
3. Tiwari, P. B., Wang, X., He, J., et al.; Analyzing surface plasmon resonance data: Choosing a correct biphasic model for interpretation. Review of Scientific Instruments (86) 3: 035001; 2015.
4. Vauquelin, G. and Charlton, S. J.; Exploring avidity: understanding the potential gains in functional affinity and target residence time of bivalent and heterobivalent ligands. British Journal of Pharmacology n/a-n/a; 2013.
Kind regards
Arnoud
Last edit: 8 years 11 months ago by Arnoud.
Please Log in or Create an account to join the conversation.
Moderators: Arnoud, Arnoud