This forum is intended for questions about kinetics, Surface Plasmon Resonance and the instruments related to these techniques.
Dipping curves
- Monica#1
- Topic Author
- New Member
-

Less
More
- Thank you received: 0
9 years 8 months ago - 9 years 8 months ago #1
by Monica#1
Dipping curves was created by Monica#1
Hi All,
I have been studing affinity kinetics of enzyme substrate on BiacoreX100. Everything was perfect when all of a sudden it BiacoreX100 started giving these weird dipping curves. Please see the attached file.
I really appreciate any help or suggestions.
Thank you and Regards
Monica
I have been studing affinity kinetics of enzyme substrate on BiacoreX100. Everything was perfect when all of a sudden it BiacoreX100 started giving these weird dipping curves. Please see the attached file.
I really appreciate any help or suggestions.
Thank you and Regards
Monica
Last edit: 9 years 8 months ago by Monica#1. Reason: spelling
Please Log in or Create an account to join the conversation.
- Arnoud
- Moderator
-

Less
More
- Thank you received: 0
9 years 8 months ago #2
by Arnoud
Replied by Arnoud on topic Dipping curves
Hi Monica,
The phenomenon could be due to impurities in the analyte. When smaller compounds bind stronger and replace weaker larger molecules the signal will get lower during the association phase.
Maybe your analyte sample is degraded.
An other explanation could be that the sample plug is mixing with the the flow buffer and therefore lowering the analyte concentration during the injection. You can check this by injection of a solution with 0.2 M NaCl. The curve should be block shaped if the sample is properly separated from the flow buffer.
Kind regards
Arnoud
Please Log in or Create an account to join the conversation.
- Monica#1
- Topic Author
- New Member
-
Less
More
- Thank you received: 0
9 years 8 months ago #3
by Monica#1
Replied by Monica#1 on topic Dipping curves
Thanks a million Arnoud. Should I be injecting 0.2M NaCl instead of analyte.
Thanks for your help
Regards
Monica
Thanks for your help
Regards
Monica
Please Log in or Create an account to join the conversation.
- Arnoud
- Moderator
-
Less
More
- Thank you received: 0
9 years 8 months ago - 9 years 8 months ago #4
by Arnoud
Replied by Arnoud on topic Dipping curves
Hi Monica,
Yes, just 0.2 M NaCl to check if the injection system works properly.
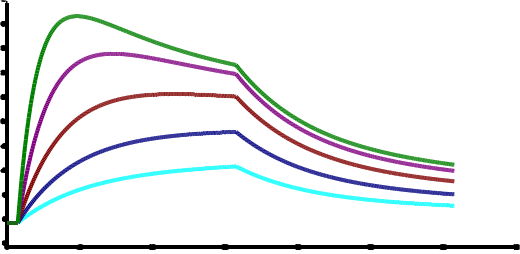
I did some simulations with BiaEvaluation. I will give the parameters so you can try it your self. Model: Heterogeneous - competing
Both analyte species with 10, 20, 40, 80, 160 nM
Analyte 1 50000 Da, Analyte 2 10000 Da, Rmax 100
ka1 1e5; kd1 0.01; ka2 1e5; kd2 0.001.
Yes, just 0.2 M NaCl to check if the injection system works properly.
I did some simulations with BiaEvaluation. I will give the parameters so you can try it your self. Model: Heterogeneous - competing
Both analyte species with 10, 20, 40, 80, 160 nM
Analyte 1 50000 Da, Analyte 2 10000 Da, Rmax 100
ka1 1e5; kd1 0.01; ka2 1e5; kd2 0.001.
Last edit: 9 years 8 months ago by Arnoud.
Please Log in or Create an account to join the conversation.
Moderators: Arnoud, Arnoud