These are the posts of the old forum. It was not possible to transfer the user data, so they are missing in most of the posts. For new questions, go to the general discussions.
Rmax question
- OldForum
- Topic Author
- New Member
-

Less
More
- Thank you received: 0
11 years 8 months ago #1
by OldForum
Rmax question was created by OldForum
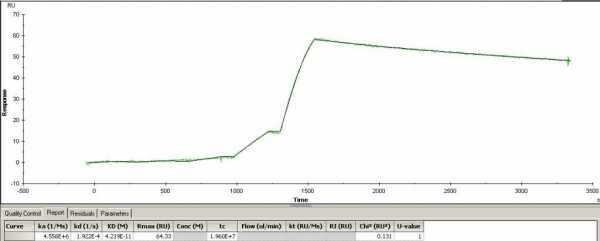
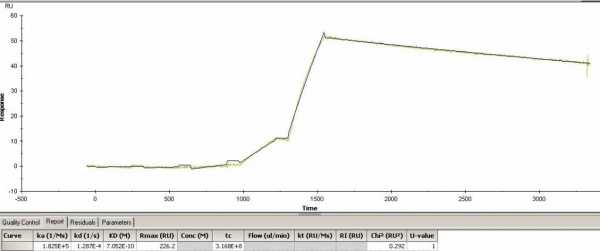
Hello. I have a question on the attached sensorgrams. One of them has an Rmax of 226 shown in the table below, but when I look at the sensorgram the RU on the Y axis is around 55. Why is this? Another sensorgram has Rmax of 64 in the table, and it matched real well with the RU on the sensorgram (around 63). It is the same sample except the Rmax of 64 was run in flow cell 3 while the Rmax of 226 was ran in flow cell 4. Single cycle kinetics. Can some explain the difference?
Thanks. mtarca
Thanks. mtarca
Please Log in or Create an account to join the conversation.
- OldForum
- Topic Author
- New Member
-

Less
More
- Thank you received: 0
11 years 8 months ago #2
by OldForum
Replied by OldForum on topic Rmax question
Hi mtarca,
can you tell the injected analyte conentrations?
Arnoud
can you tell the injected analyte conentrations?
Arnoud
Please Log in or Create an account to join the conversation.
- OldForum
- Topic Author
- New Member
-

Less
More
- Thank you received: 0
11 years 8 months ago #3
by OldForum
Replied by OldForum on topic Rmax question
The Rmax is the maximal feasible signal. Rmax is determined by the amount of binding sites (ligand concentration) and the size of the ligand and analyte molecule. Therefore, Rmax is fitted locally when different analyte molecules are used over the same surface.
The Req is the response when the interaction between ligand and analyte is at equilibrium. Req is determined by the maximal number of binding sites (RMax), kinetics (ka, kd) and the concentration of the analyte (C).
When fitting curves both Rmax and Req are fitted parameters. This means that the program tries to determine the best values for these parameters. Even is the analyte concentration range is not saturating the ligand (reaching Rmax) the fitting will calculate the theoretical Rmax. That holds also for the Req. Even if the injection time is not long enough to reach equilibrium (steady state) it will calculate the theoretical Req.
Now for the curves.
Because I can not simulate the single cycle kinetics, I did it the classical way. It makes no difference to understand.
Above two simulations. If you look carefully in the left lower corner you will see the simulation of your experiment. And the other longer curves are two hour association curves of which only the 5 nM will reach equilibrium and not Rmax because the analyte concentration is to low.
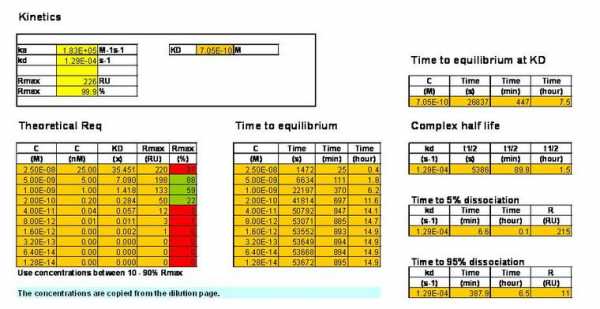
To reach Rmax the analyte concentration must be at least 40 – 50 times KD. In your case 25 nM is about 97% Rmax. You can try to simulate it yourself.
You don not tell what the difference (ligand type or density?) in ligand surface is between flow cell 3 and 4. In addition the association kinetics between the two flow cells is different.
Please Log in or Create an account to join the conversation.
- OldForum
- Topic Author
- New Member
-

Less
More
- Thank you received: 0
11 years 8 months ago #4
by OldForum
Replied by OldForum on topic Rmax question
Hi Arnoud,
I immobilized Protein A on a CM5 using NHS/EDC amine coupling. RL found was ~4800. I then passed my Ab on the surface through FC 3 and 4 and found RU of 400 (FC3) and 375 (FC4). Then my Ag (Mw: 17500).
I suppose my question is which result/KD do I trust? I do observe the 4.22E-11 M had a much better fit. Kindly comment. Thanks.
matarca
Please Log in or Create an account to join the conversation.
- OldForum
- Topic Author
- New Member
-

Less
More
- Thank you received: 0
11 years 8 months ago #5
by OldForum
Replied by OldForum on topic Rmax question
Since both ligand and analyte are the same you can fit both curves simultanously.
ka, kd are global parameters, Rmax and tc are local parameters.
If the fit does not work try to "build from scratch".
1) fit dissociation alone and use this as fixed parameter in 2)
2) fit all parameters local and fix kd with value from 1)
3) fit as 2) but use ka global
4) fit as 3 but ka and kd global
5) etc. add RI only in the final fitting.
Let us know if it works.
Arnoud
Please Log in or Create an account to join the conversation.


