Quiz answers
This are the questions and answers from the book 'Handbook of Surface Plasmon Resonance.'
Question 1.
Looking at the following sensorgrams, which sensorgram does not contain exponential interaction curves?
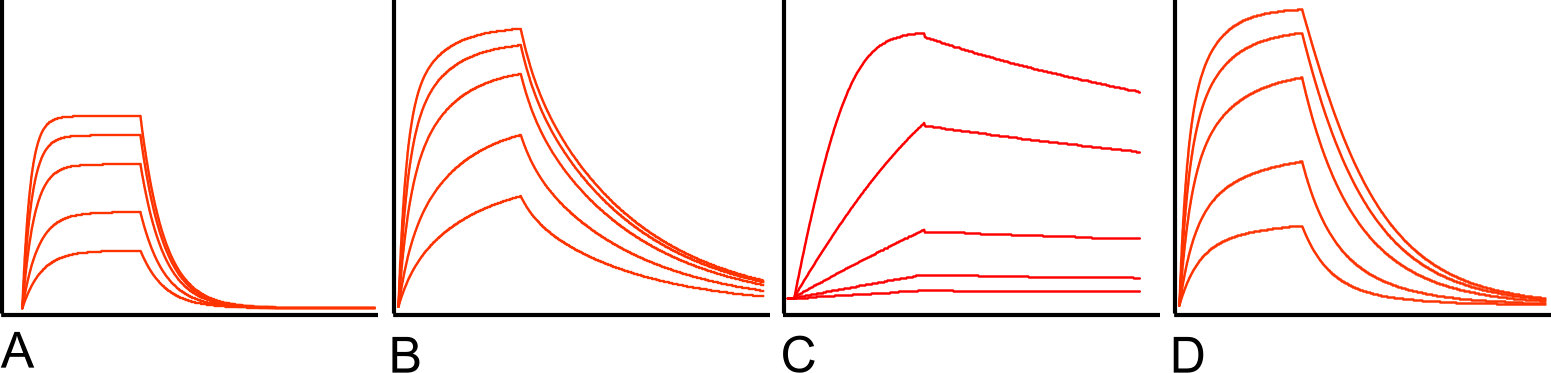
Answer C: A: exponential B: exponential C: mass transport limitation D: exponential
Mass transport limited sensorgrams have an initial binding profile that is linear.
Question 2.
Which of the following sensorgrams can be used for equilibrium analysis?

Answer C: only in C all the curves come to steady state.
The answer in the book says: Answer D ... but it is C.
Question 3.
The figure shows four curves with different kinetic rate constants but with the same affinity. Which curve has the fastest association rate constant?

A: curve A
B: curve B
C: the analyte concentration should be known
D: the Rmax should be known
Answer C: the analyte concentration should be known. Because the association rate is analyte concentration dependent nothing can be said about the association by looking at a curve.
Question 4.
Giving the affinity plot, which curve has the highest equilibrium dissociation constant?

A: point A
B: They are all the same
C: the analyte concentration should be known
D: point D
Answer B: They are all the same. All the points are on the same green line of K D = 10-9 M
Question 5.
Which of the following fitting results should be reported?

A: Wrong because this is excel notation
B: Wrong because the units are not correct. It is not 1/Ms but M-1s-1
C: Wrong because the digits in the error with the K D are incorrect (double digit instead of one)
D: Correct
Question 5.
When this is the result of the fitting. Which is the best combination of options to better it?

- Option 1: lower ligand concentration
- Option 2: match buffers better
- Option 3: equilibrate better
- Option 4: use higher flow rate
Answers
A: Options 1 and 4
B: Options 1, 2 and 3
C: Options 1, 2 and 4
D: Options 2, 3 and 4
Answer B
Question 7.
With the four options below, what is the best combination to optimize this interaction?

- Option 1: lower ligand concentration
- Option 2: match buffers better
- Option 3: check the ligand for purity
- Option 4: use higher flow rate
Answers
A: Options 1 and 3
B: Options 1 and 4
C: Options 2 and 3
D: Options 2 and 4
Answer A
Question 8.
Are the values given in the inset plausible with this sensorgram?

A: yes
B: no, dissociation looks faster
C: no, dissociation looks slower
D: no, Rmax is to high
Answer A. The analyte concentration is the same as the equilibrium dissociation constant thus R eq is half R max.
Question 9.
What can be said about this sensorgram?

A: the analyte concentration range is not wide enough
B: the response is not following exponential kinetics
C: there is mass transport limitation
D: this looks a fine sensorgram
Answer D: this looks a fine sensorgram. Probably some higher analyte concentration injections would be make clearer that the ligand is saturating but evaluation of these curves will yield correct kinetic parameters.